TQQQ 6-day bearish forecast — Nov 8, 2026
- Bias: Bearish
- Timeframe: 6 days (made Nov 8, 2026, target date Nov 13, 2026)
- Price at analysis: $52.25
- Price target: $50.80
- Expected range: $49.80 – $54.00
- Result: Incorrect (+7.8%) — closed at $56.30 on Nov 13, 2026; quality score 0/100
Get a free AI analysis of TQQQ today
Analysis
TECHNICAL INDICATORS
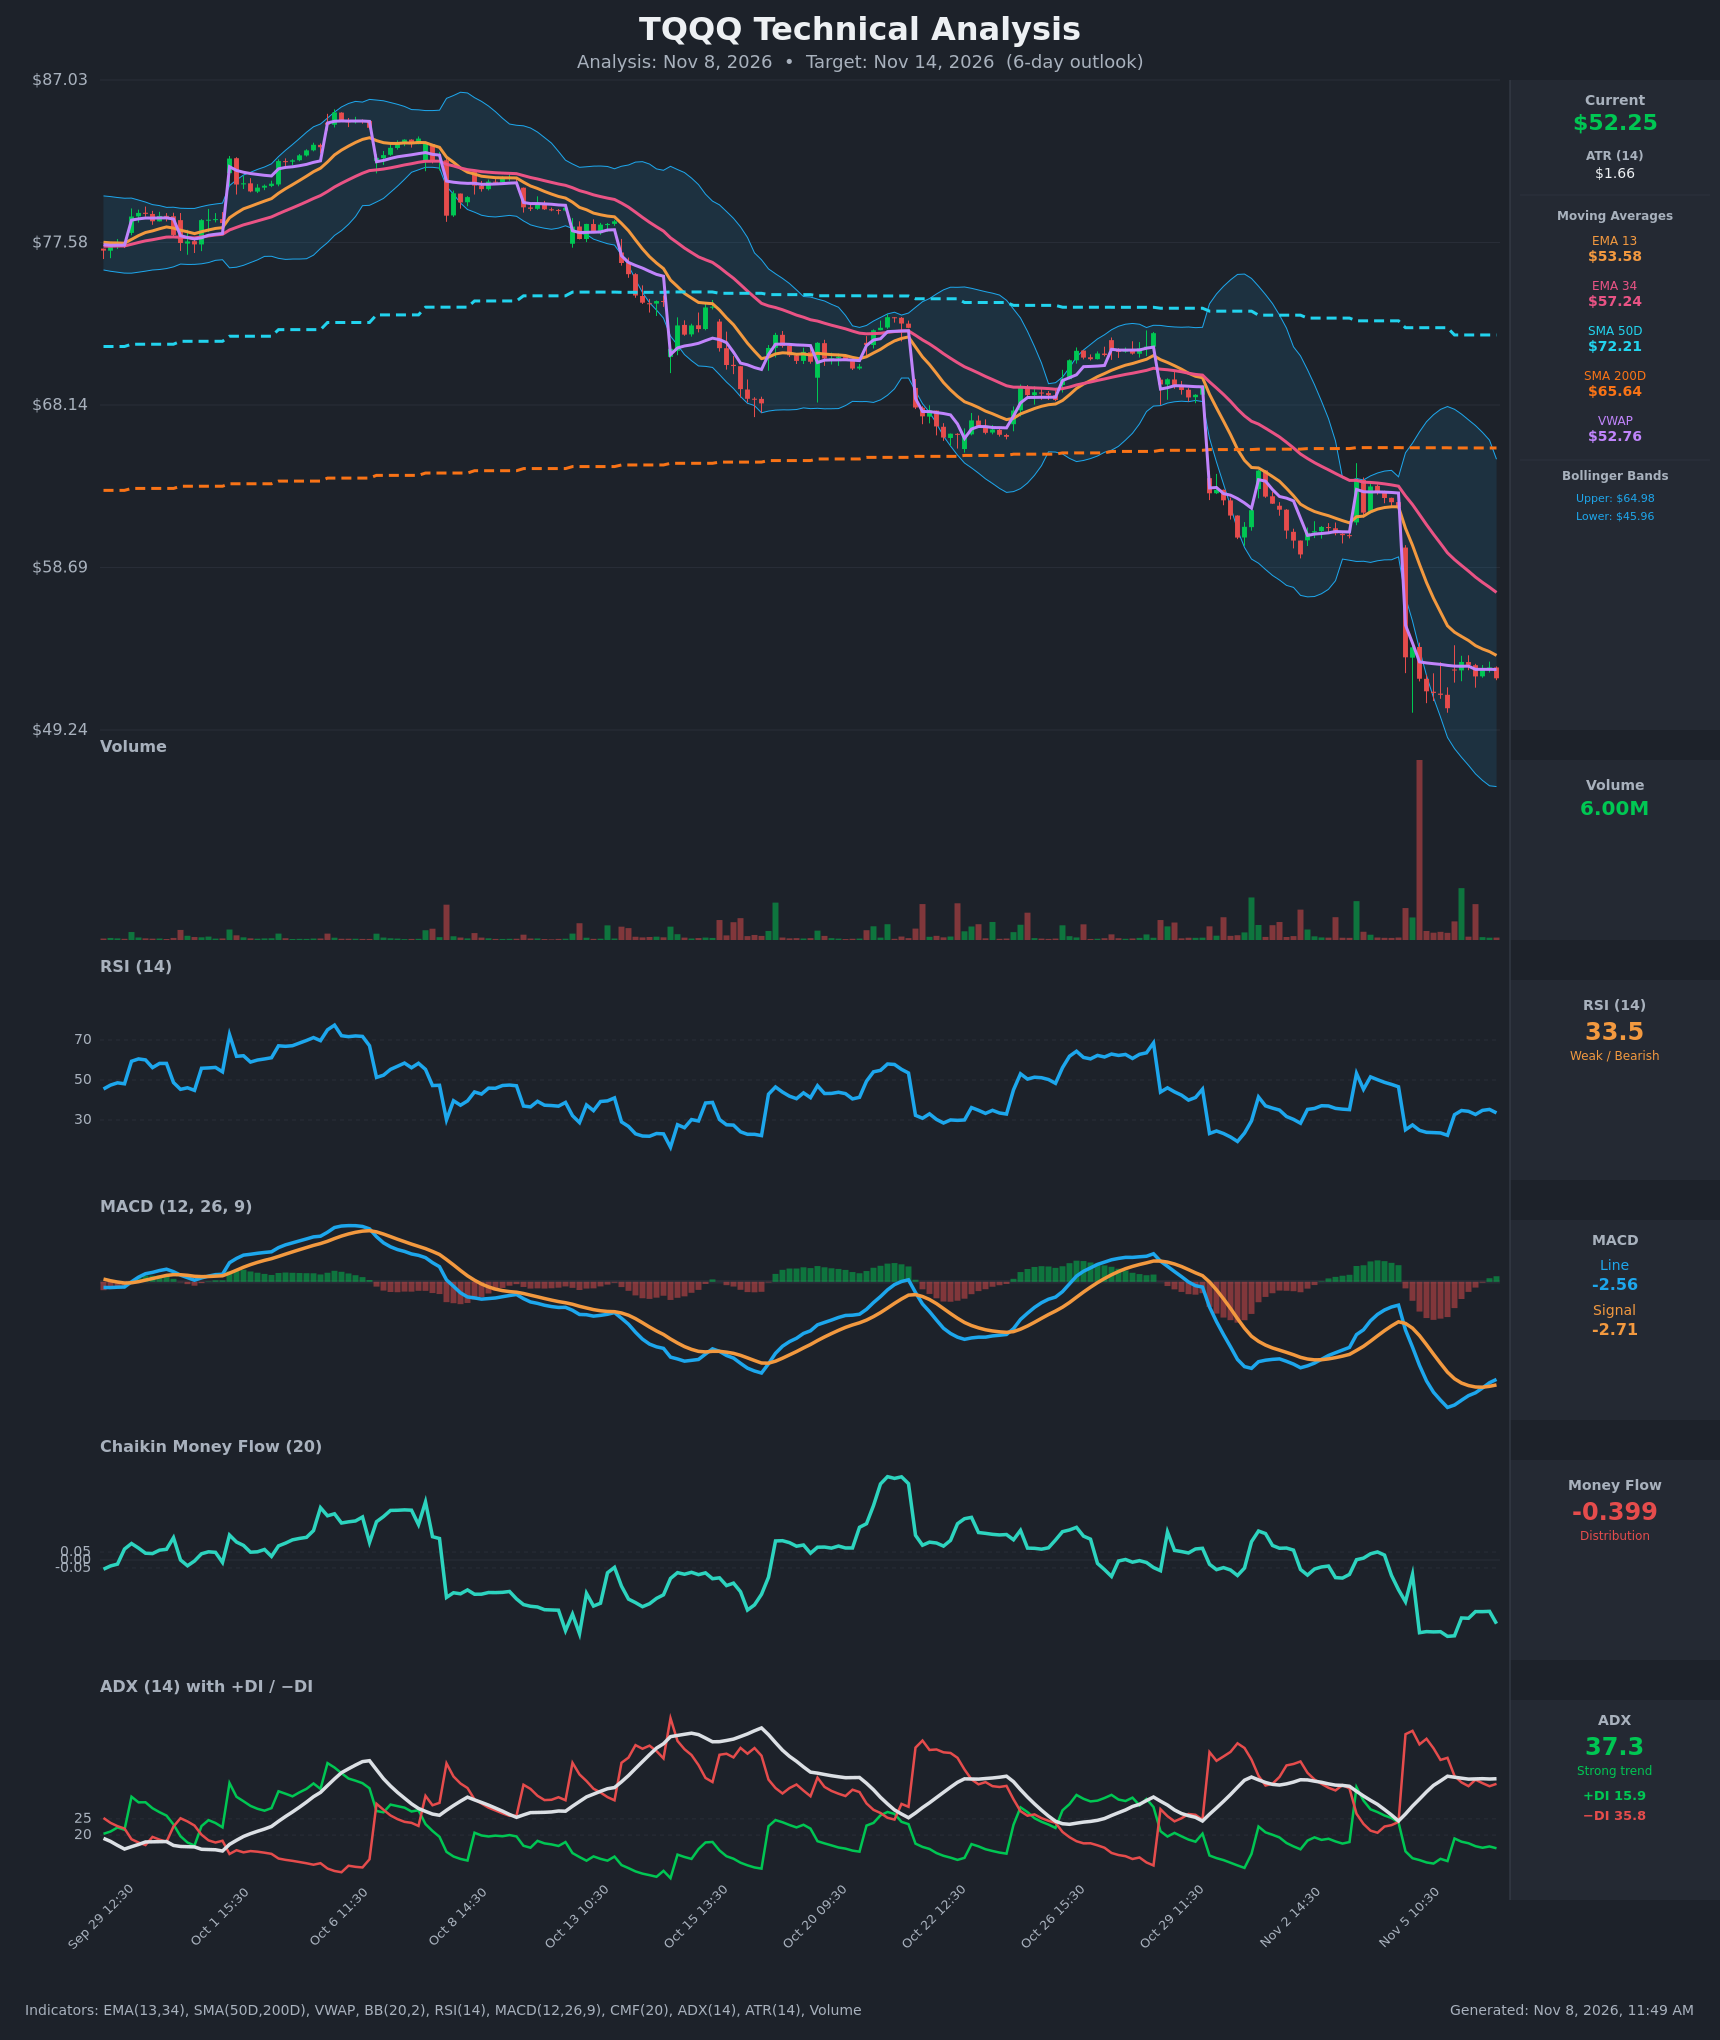
- RSI (14): 33.54. It dropped to a deeply oversold 22.3 on Nov 5 and has rebounded only to the 33-35 zone, where it is stalling just above oversold. Momentum is weak but no longer in free fall. [Bearish]
- 20 EMA: Only EMA 13 ($53.58) and EMA 34 ($57.24) are supplied, so these stand in for the short-term average. Price at $52.25 is below both, and both are sloping down. EMA 13 sits about 2.5% overhead and acts as near-term resistance. EMA 13 stays below EMA 34, with the gap widening from a bearish cross that is already in place. [Bearish]
- MACD: The line (-2.564) has just crossed above the signal (-2.710), and the histogram is slightly positive (about +0.15). Both lines remain deep below zero. This is an early, low-quality relief signal, not a trend reversal. [Neutral]
- Bollinger Bands (20): Upper $64.98, lower $45.96, so the bands are very wide after the gap-down. Price is in the lower half, well below the midline of about $55.5, with about $6.3 of room to the lower band. After the Nov 5 breakdown, price has been "walking" below the mid-band rather than mean-reverting. [Bearish]
- CMF (20): -0.399, far below the -0.05 threshold. This is heavy, sustained distribution, and no accumulation has appeared even during the small bounce. [Distribution]
- ADX (14): 37.3 with −DI 35.8 far above +DI 15.9. ADX is flat to slightly lower from its 38.1 peak, so the trend is strong but maturing, with bears firmly in control. [Strong Trend - Bearish]
- Volume: 6.00M on the latest bar, and the chart shows a huge red spike on the Nov 5 open gap-down. Volume has faded since, which fits a pause or consolidation rather than a fresh capitulation. Price is also slightly below VWAP ($52.76). [Bearish bias, fading selling pressure]
DIVERGENCES & TRENDS
- Price is below SMA50D ($72.21) and SMA200D ($65.64), and SMA50D is well above SMA200D. The long-term structure is damaged, and price is roughly 20% under the 200-day average.
- EMA 13 sits below EMA 34, and both are falling. Price has repeatedly failed at the EMAs in the Nov 5-6 bounce.
- The MACD bullish crossover (Nov 6, 13:30) is below the zero line. Historically in this chart, sub-zero crosses have been short-lived rallies within the downtrend.
- RSI shows a mild higher low (22.3 to 32-35) while price has only stabilised in the $50.5-$53.2 range. This is early stabilisation, not a confirmed bullish divergence, and RSI is capped near 35.
- −DI remains well above +DI. There has been no DI crossover, and CMF stays deeply negative.
- Price is hugging VWAP ($52.76) after a gap-down. This is a pause in a downtrend, not a reversal.
CHART PATTERNS
- Bearish Pennant / Bearish Flag (continuation): After the sharp drop from about $62 to $51 (the pole), price has formed a tight, narrow consolidation between about $50.5 and $53.2 on declining volume. A break below about $50.50 would confirm the pattern. The full measured move is large, but over 6 days a partial move to about $49-$50 is the realistic target.
- Alternative read: A possible short-term base or double-bottom near $50.5-$51.3 is not confirmed, because there is no break above about $53.6 and indicators such as CMF do not support it.
- Resistance cluster: EMA 13 at about $53.58, the Nov 6 morning highs near $53.20-$54.05, and VWAP at about $52.76.
POTENTIAL SCENARIOS
- Scenario 1: Bearish Pennant Breakdown — Price fails at the EMA 13 / VWAP zone, breaks the consolidation low, and continues the downtrend as −DI and distribution persist. Trigger: close below $50.50 on rising volume. Target: $49.00-$50.80, with an extension toward the lower Bollinger Band ($45.96) if selling accelerates. Invalidation: a hourly close above $54.05. (55% probability)
- Scenario 2: Bullish Relief Bounce — The MACD cross and oversold RSI drive a short-covering rally back to the overhead moving averages. Trigger: close above $53.60 (EMA 13) with a rising RSI above 40. Target: $55.50-$57.00 (Bollinger mid-band and EMA 34). Invalidation: loss of $50.50. (33% probability)
- Scenario 3: Neutral Sideways Chop — Price keeps oscillating between about $50.5 and $53.5 as selling exhausts and buyers stay absent. Trigger: no break of either range edge. Target: $51.50-$53.00. Invalidation: a close outside $50.50-$54.00. (12% probability)
PRICE TARGETS
- Target Price: $50.80 (6-day target, about -2.8%)
- Expected Range: $49.80 to $54.00 (width $4.20, about 8.0% of current price, consistent with the 6-day guidance of roughly 4-8%)
- Key Levels: Support at $50.50, Resistance at $53.58
OVERALL BIAS
OVERALL BIAS: BEARISH - Price is below every moving average with a strong ADX (37.3), −DI dominating (35.8 vs 15.9), and deep distribution (CMF -0.40), while the small consolidation after the gap-down resembles a bearish pennant. The fresh MACD cross and near-oversold RSI argue for a relief bounce, but the stronger evidence points lower.
This is educational analysis and not financial advice.