SPCX 4-day bullish forecast — Nov 8, 2026
- Bias: Bullish
- Timeframe: 4 days (made Nov 8, 2026, target date Nov 11, 2026)
- Price at analysis: $134.19
- Price target: $136.00
- Expected range: $130.50 – $140.00
- Result: Correct (+3.3%) — closed at $138.58 on Nov 11, 2026; quality score 100/100
Get a free AI analysis of SPCX today
Analysis
TECHNICAL INDICATORS
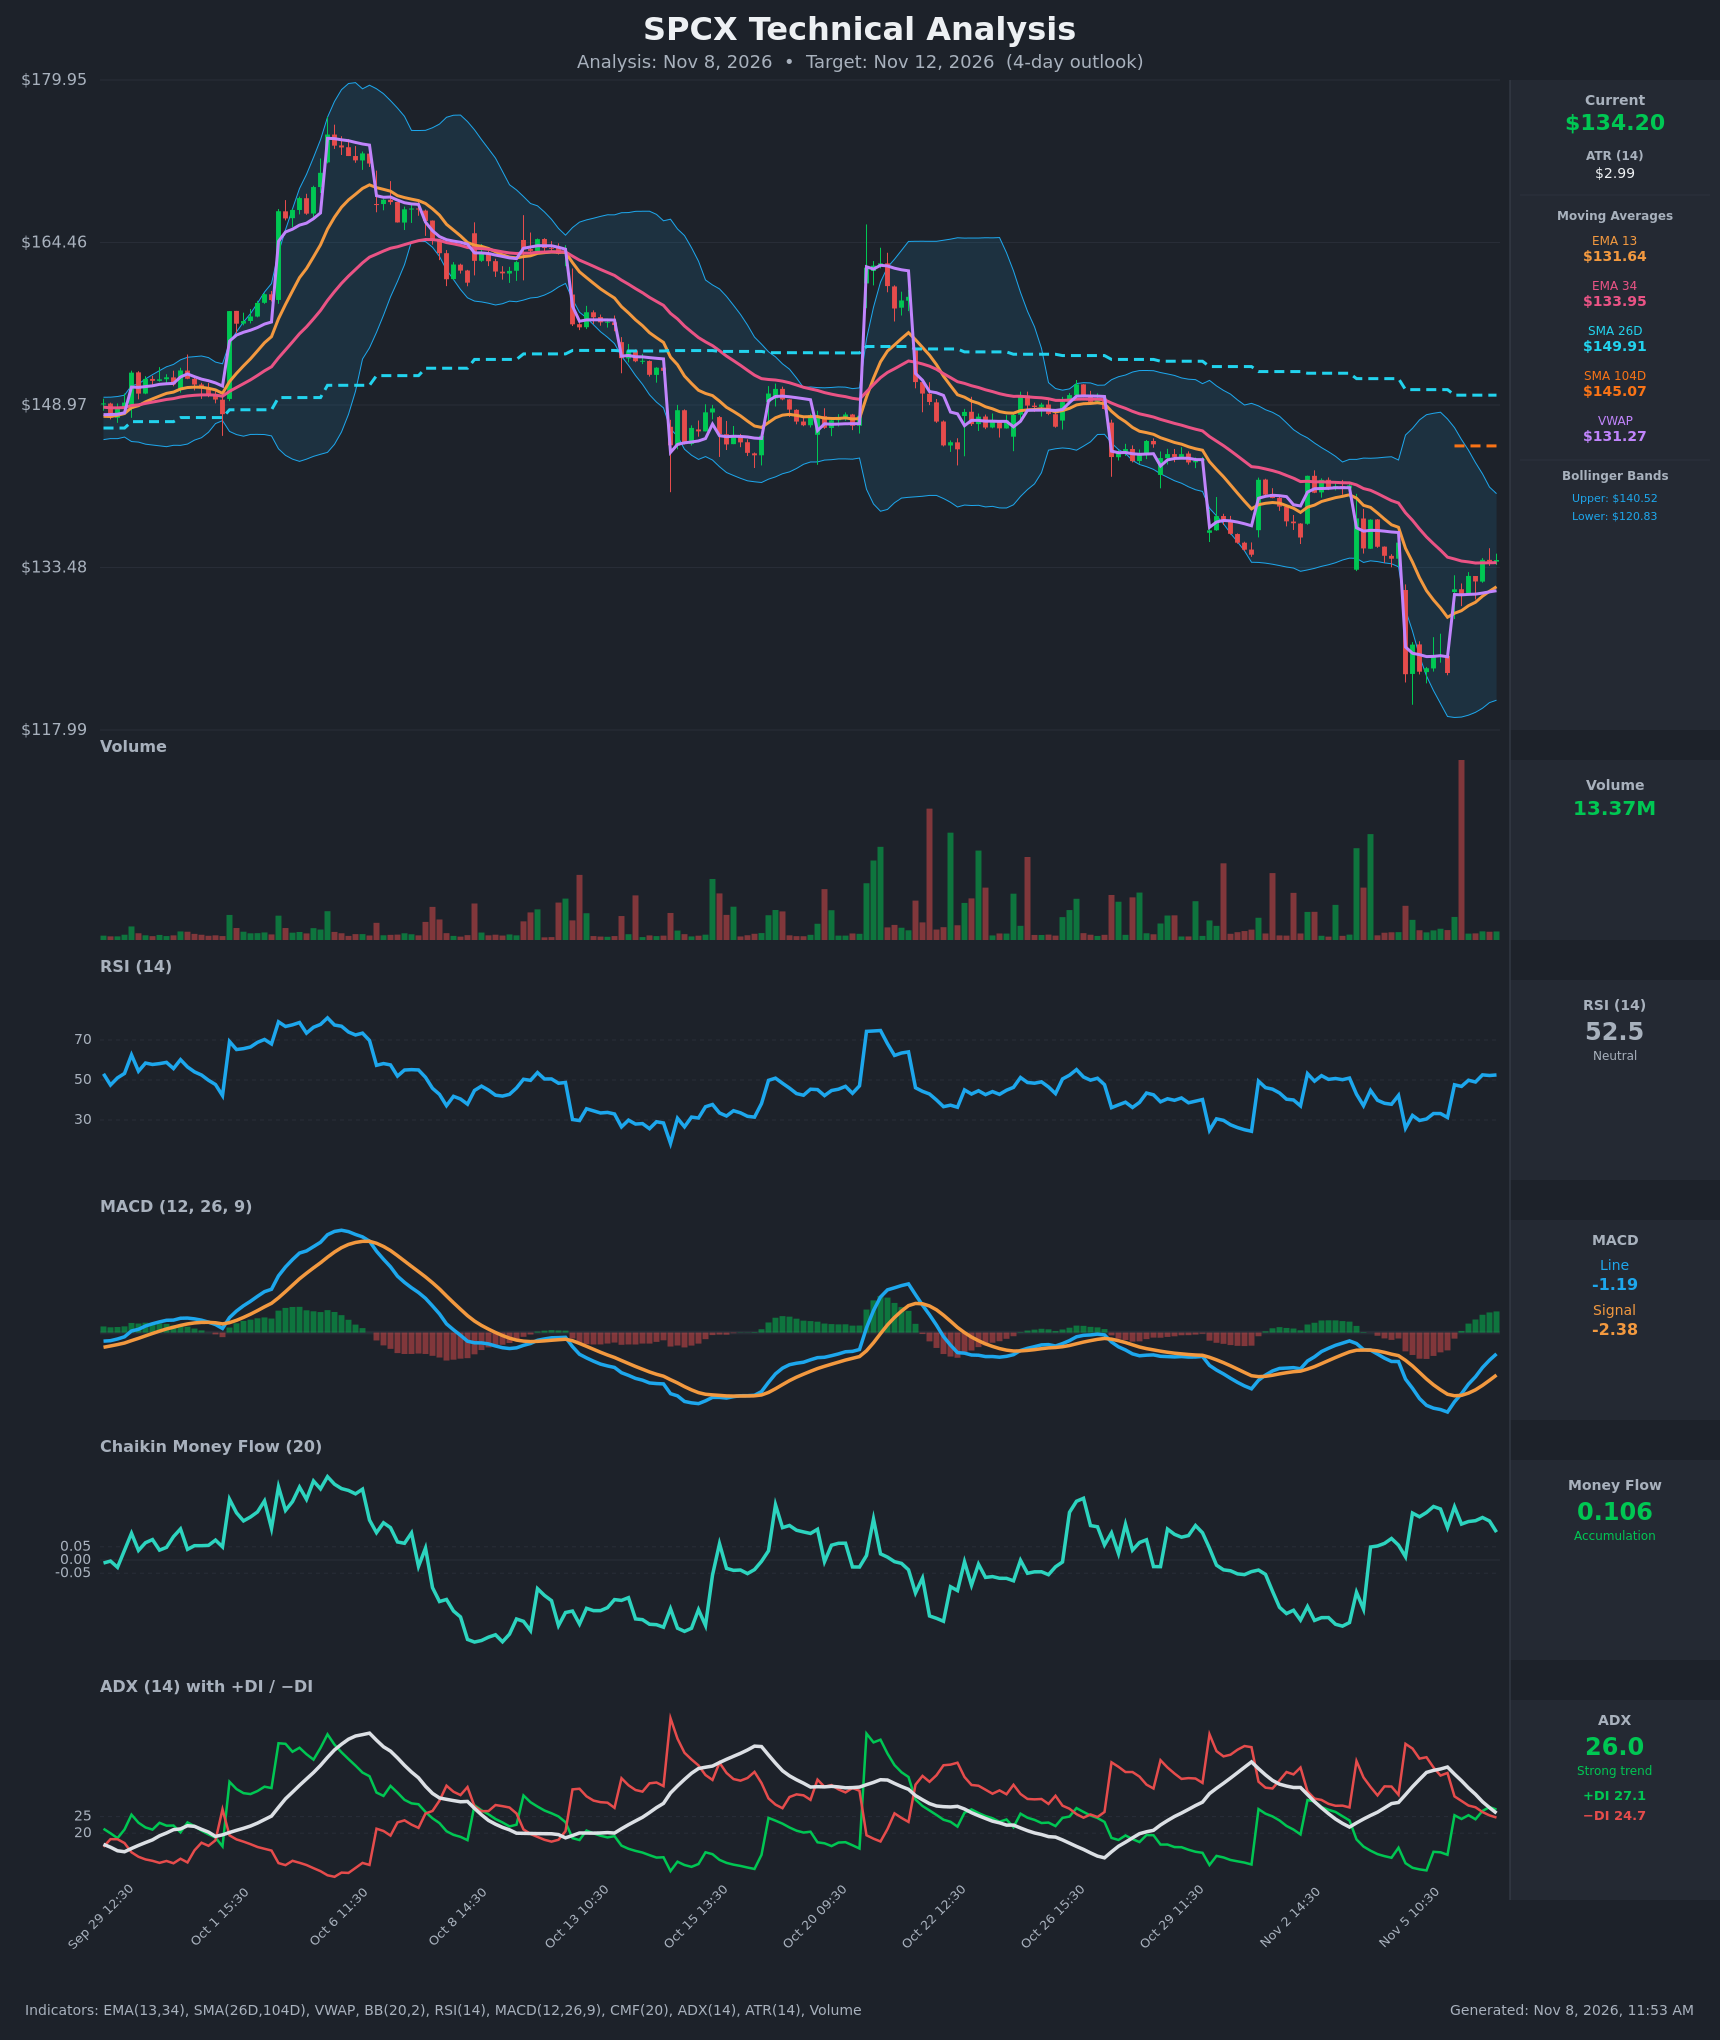
- RSI (14): 52.53, up from the 25.9 oversold low on Nov 5 and now sitting just above the 50 midline. It has stalled near 52 for the last few bars, so momentum is recovering but not accelerating. [Neutral]
- 20 EMA: The chart shows EMA 13 at $131.64 and EMA 34 at $133.95. Price at $134.20 is above EMA 13, which acts as support, and has just reclaimed EMA 34. EMA 13 is still below EMA 34 (no bullish cross yet), but the gap has narrowed from about $7 to $2.3. [Bullish]
- MACD: Line -1.195 is above signal -2.383 after a bullish crossover on Nov 6 at 09:30–10:30. The histogram is positive at about +1.19 and rising, though both lines remain below zero, so this is a recovery bounce inside a larger downtrend. [Bullish]
- Bollinger Bands (20): Upper $140.52, lower $120.83, midline about $130.70. Price is just above the midline after bouncing off the lower band on Nov 5. The bands are wide after the gap-down volatility. Room to the upper band is about $6.3, and the mid-band is near support. [Neutral]
- CMF (20): 0.106, above the +0.05 threshold and positive for several sessions. It is a bit off its recent peak but still shows buying pressure on the bounce. [Accumulation]
- ADX (14): 26.0 and falling from 39.8, so the prior bearish trend is losing strength. +DI (27.1) has crossed above −DI (24.7), a fresh bullish DI crossover, though the spread is thin. [Weak-to-Moderate Trend, turning Bullish]
- Volume: 13.37M. The capitulation spike on Nov 5 was the largest on the chart. Volume has since faded to average levels on the bounce, which signals a lack of strong conviction but also no heavy selling. [Neutral]
DIVERGENCES & TRENDS
- Trend: The multi-week trend is clearly down, with lower highs from about $172 to $150 to $140. Price is far below SMA26D ($149.91) and SMA104D ($145.07), and SMA26D remains above SMA104D, so there is no death cross yet.
- Recovery: Price has retraced from the $123 low to $134, back above the VWAP ($131.27) and EMA 34.
- Momentum: MACD crossed bullish and +DI crossed above −DI. RSI rose from oversold to 52.
- Divergence: No clear divergence. RSI made a higher low (25.9 versus 29.8 intraday) while price made a similar low, which is only a mild positive hint.
- Overhead resistance: The gap area near $140–145 and the SMA104D at $145.07 are significant supply zones.
CHART PATTERNS
- Bullish V-shaped recovery after a capitulation gap-down: This is not a textbook pattern from the reference diagram, but price has since formed a tight rising channel and is rebuilding.
- Bullish Falling Wedge (broad): The decline from October highs with converging lower highs and a lower low at $123 loosely resembles a falling wedge. The bounce is the early breakout phase. The measured target is the $140–145 gap zone.
- Caveat: The bounce is a retracement within a larger downtrend (price below both SMAs), so the upside is likely capped near $140 in a 4-day window.
POTENTIAL SCENARIOS
- Scenario 1: Bullish Continued Recovery — Price holds above EMA 34 and VWAP and grinds toward the upper Bollinger Band as MACD and +DI stay supportive. Trigger: Close above $135.50 with CMF staying positive. Target: $138.50–$140.50. Invalidation: Close below $131.30 (VWAP/EMA 13). (50% probability)
- Scenario 2: Neutral Consolidation — Price chops between EMA 13 and the $137 area while ADX fades and volume stays muted. Trigger: Failure to break $136 or $131.50. Target: $132–$136. Invalidation: Close outside that range on volume. (28% probability)
- Scenario 3: Bearish Failed Bounce — The rally stalls at EMA 34, which is resistance, and the larger downtrend resumes. Trigger: Close below $131.30. Target: $125–$127. Invalidation: Close above $137. (22% probability)
PRICE TARGETS
- Target Price: $136.00 (4-day)
- Expected Range: $130.50 to $140.00 (width $9.50, about 7.1% of current price, in line with the 7–10 day guidance and appropriately wider than a 2–3 day range given the ATR of $2.99)
- Key Levels: Support at $131.30 (VWAP/EMA 13 zone), Resistance at $140.50 (upper Bollinger Band)
OVERALL BIAS
OVERALL BIAS: BULLISH - A bullish MACD crossover, +DI crossing above −DI, price reclaiming EMA 34 and VWAP, and sustained CMF accumulation favor further recovery toward $136–$140. The larger downtrend and overhead SMA resistance cap the upside, so conviction is moderate.
This is educational analysis and not financial advice.