SPCX 83-day bearish forecast — Nov 15, 2026
- Bias: Bearish
- Timeframe: 83 days (made Nov 15, 2026, target date Feb 5, 2027)
- Price at analysis: $139.11
- Price target: $131.00
- Expected range: $117.00 – $148.00
- Result: Pending — graded after the close on Feb 5, 2027
Get a free AI analysis of SPCX today
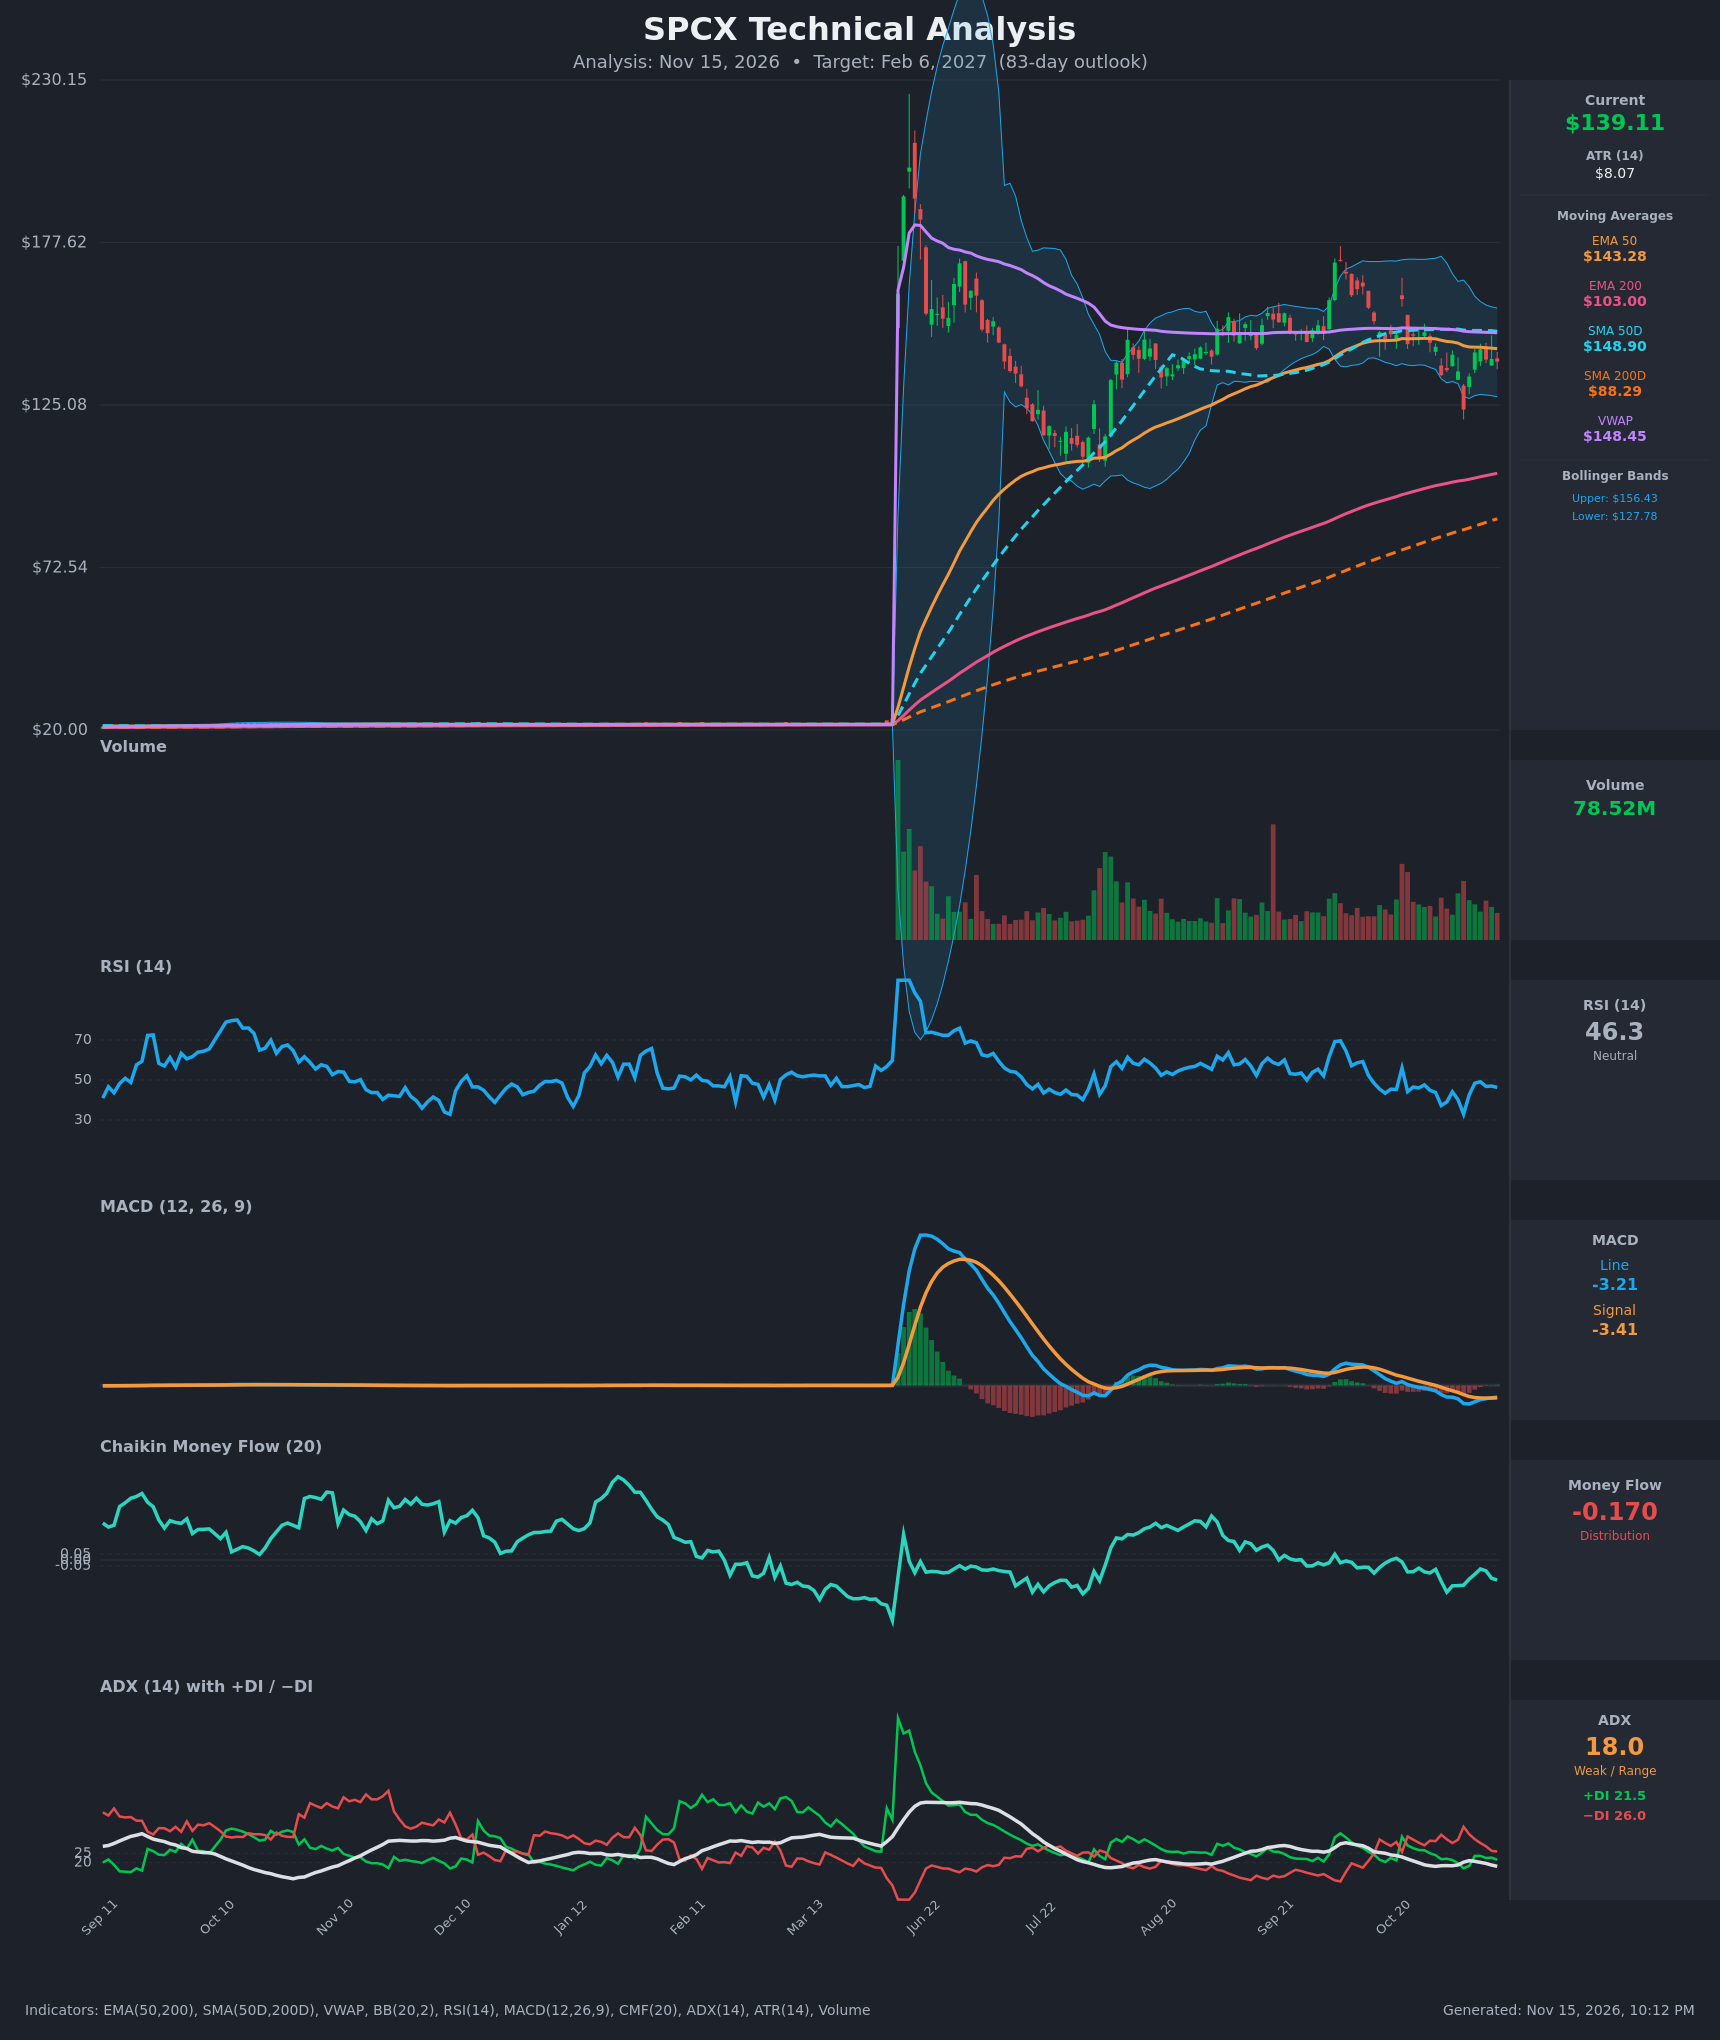
Analysis
TECHNICAL INDICATORS
- RSI (14): 46.32, just under the 50 midline. It was 49.1 on Nov 10 and has drifted lower, after a 32.9 oversold flush on Nov 5. Momentum is soft with no bullish expansion. [Neutral]
- 20 EMA: No 20 EMA value was supplied, so I use the Bollinger midline (~$142.10) as the 20-period proxy. Price at $139.11 sits below it, and below EMA50 ($143.28), SMA50D ($148.90) and VWAP ($148.45). Overhead averages act as resistance, and price has been below the 50-day average since the Oct 30 drop. [Bearish]
- MACD: Line -3.21 vs signal -3.41, histogram about +0.20. A minor bullish crossover occurred around Nov 12, but both lines are well below zero and the crossover is shallow. It signals some downside momentum exhaustion rather than a trend reversal. [Neutral]
- Bollinger Bands (20): Upper $156.43, lower $127.78, midline ~$142.10. Price is in the lower half of the bands, below the midline, with moderate band width. The Nov 5 low pierced the lower band and bounced, but each rally has failed near the midline. [Bearish]
- CMF (20): -0.170, well below -0.05. It has been negative for months and has fallen from -0.069 to -0.170 over the last 15 bars. Rallies are being sold into. [Distribution]
- ADX (14): 18.0, below 20, so the trend is weak or range-bound. −DI (26.0) is above +DI (21.5), so bears have the edge. The DI gap has narrowed from the Nov 5 extreme (39.1 vs 17.0). [Weak Trend, Bearish lean]
- Volume: 78.52M. Red volume bars are larger than green ones on the recent selloffs, and there is no volume expansion on the bounces. Rebounds look low-conviction. [Mildly Bearish]
DIVERGENCES & TRENDS
- No clear price/RSI divergence: Price made a lower swing in early Nov (Nov 5 close $123.62). RSI hit 32.9, not a deeply oversold extreme, and recovered quickly, so there is no actionable divergence.
- CMF: It is trending down and has stayed negative through the Aug–Sep rally. It never confirmed the push toward ~$175, which is a mild bearish divergence in the larger swing.
- MACD: The histogram is turning up from deeply negative levels, a possible early sign of selling exhaustion. It remains below zero.
- Moving averages: There is no death cross. SMA50D ($148.90) is far above SMA200D ($88.29), and EMA50 ($143.28) is above EMA200 ($103.00). EMA50 is rolling over (peak ~$146.6, now $143.3) and SMA50D has flattened and started to slip. Price is still well above the rising 200-day averages, so the long-term trend is intact.
- DI: −DI has been above +DI throughout the last 15 bars. Bears are in control but ADX shows no strong trend.
- Price structure: Lower highs from the ~$175 peak (Sep–Oct) to ~$150 (Oct), with support around $123–127.
CHART PATTERNS
- Descending Triangle / lower-high compression (loose fit): Lower highs (~$175 → ~$150) pressing on horizontal support in the $123–127 zone (Nov 5 low, Bollinger lower band). A confirmed close below ~$123 would project a measured move of roughly $25 downward, to about $98–100. The rising EMA200 (~$103–115 over the horizon) is likely to cushion that.
- Bearish Symmetrical / range behavior: ADX at 18 supports a broad $123–$150 range, so the pattern is unconfirmed until support or the $149 resistance breaks.
- Bullish counter-case: The Nov 5 low and rebound resemble a Double Bottom attempt, but it needs a close above ~$149–150 (SMA50D/VWAP) to activate. The target would be ~$165–175.
- Overall: Pattern evidence is modestly bearish and low-conviction.
POTENTIAL SCENARIOS
- Scenario 1: Bearish Breakdown of Range Support — Lower highs, negative CMF and −DI dominance lead to a break of the $123–127 support zone, with a drift toward the rising EMA200. Trigger: daily close below $123 on rising volume. Target: $115–$120, extended toward $105–$110. Invalidation: daily close above $149 (SMA50D/VWAP). (45% probability)
- Scenario 2: Neutral Range Consolidation — Price chops between ~$125 and ~$150 as ADX stays under 20 and the MACD crossover supports stabilization. Trigger: holds $127 on pullbacks and is rejected near $148–150. Target: $132–$146. Invalidation: close outside $123–$150. (30% probability)
- Scenario 3: Bullish Reclaim — The MACD turn and Nov 5 reversal build into a double-bottom-style recovery. Trigger: close above $149–$150 with CMF rising back above 0. Target: $160–$170. Invalidation: close back below $135. (25% probability)
PRICE TARGETS
- Target Price: $131.00 (83 days, about Feb 6, 2027)
- Expected Range: $117.00 to $148.00 (width $31 ≈ 22% of the current price, consistent with the 61–180 day guidance of 18–30%)
- Key Levels: Support at $123.00, Resistance at $148.90
OVERALL BIAS
OVERALL BIAS: BEARISH - Price is below the 50-day averages and VWAP with persistent distribution (CMF -0.170) and −DI above +DI, and lower highs are pressing on $123–127 support. The shallow MACD crossover and the rising 200-day averages limit downside, so conviction is modest.
This is educational analysis and not financial advice.