SPCX 62-day bearish forecast — Nov 15, 2026
- Bias: Bearish
- Timeframe: 62 days (made Nov 15, 2026, target date Jan 15, 2027)
- Price at analysis: $139.11
- Price target: $131.00
- Expected range: $117.00 – $152.00
- Result: Pending — graded after the close on Jan 15, 2027
Get a free AI analysis of SPCX today
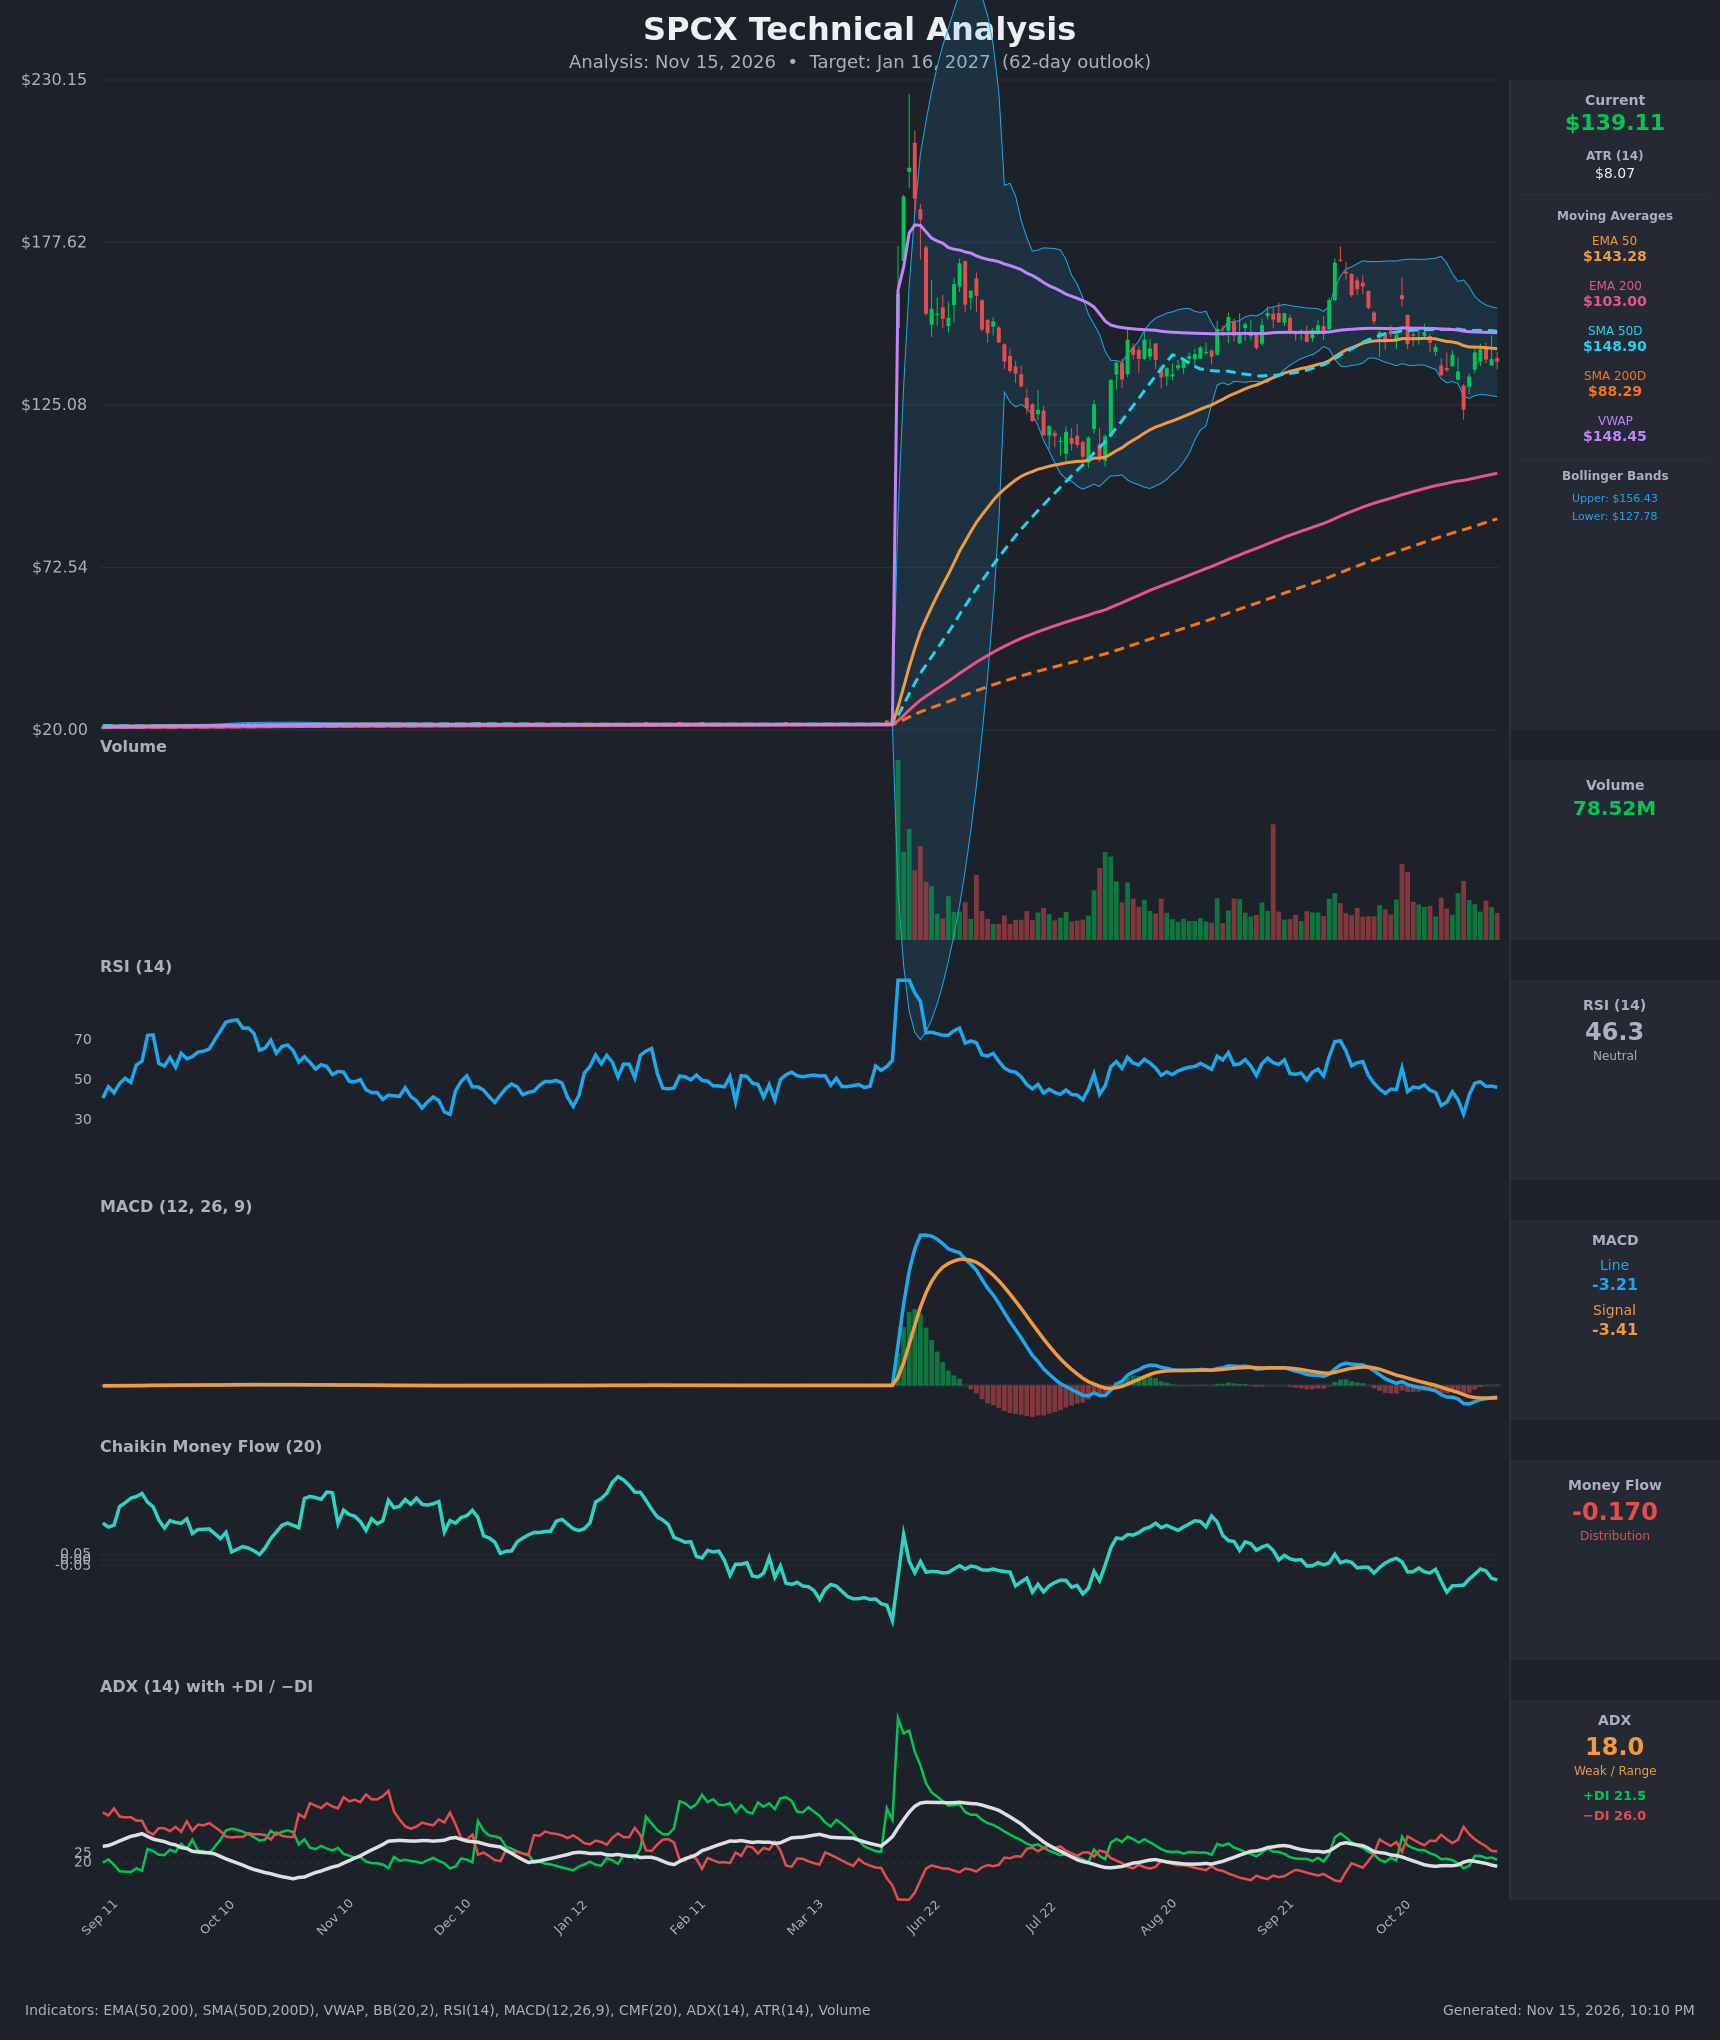
Analysis
TECHNICAL INDICATORS
- RSI (14): 46.32, just under the 50 midline. It rebounded from an oversold-ish 32.9 on Nov 5 to 49.1 on Nov 10, then drifted lower again. Momentum is flat to slightly weak, with no overbought or oversold signal. [Neutral]
- 20 EMA: The 20 EMA value isn't provided. Using the EMA 50 at $143.28 instead, price ($139.11) is about 2.9% below it, and the EMA 50 has rolled over from $146.62 on Oct 27. The EMA 200 at $103.00 is far below and still rising, so the long-term structure holds. Price is below the short-to-medium-term dynamic resistance. [Bearish]
- MACD: Line -3.21 vs signal -3.41. The line crossed back above the signal on Nov 13, so the histogram is slightly positive (+0.20) and rising. Both lines are still below zero, and the earlier bearish cross on Oct 30 pushed MACD to -5.08. This is a tentative, weak bullish crossover below the zero line. [Neutral]
- Bollinger Bands (20): Upper $156.43, lower $127.78, midline about $142.10. Price sits in the lower half, below the midline, and is well off the Nov 5 band-breaking low of $123.62, which got bought quickly. Bandwidth is moderate with no squeeze or expansion. Price below the midline is a mild negative. [Bearish]
- CMF (20): -0.170, well below -0.05. It has been negative through the whole recent window (-0.07 to -0.27) and was not repaired by the Nov 9–10 bounce. Sellers are using rallies to distribute. [Distribution]
- ADX (14): 18.0, below 20, so the trend is weak or range-bound. −DI (26.0) is above +DI (21.5), so bears hold a mild directional edge. The gap narrowed from the Nov 5 extreme (17.0 vs 39.1), but bulls haven't regained control. [Weak Trend, bearish lean]
- Volume: 78.52M on the latest bar. Volume is elevated relative to the quiet mid-range sessions. Heavy red bars appeared on the sell-offs (Oct 30, Nov 5), while the bounce volume was unremarkable. The volume profile slightly favors sellers. [Mildly Bearish]
DIVERGENCES & TRENDS
- Moving averages: SMA50D ($148.90) is flat to slightly declining. VWAP ($148.45) is also drifting lower and sits well above price. Price is below both, but still far above the EMA 200 ($103.00) and SMA200D ($88.29). The medium-term trend has stalled inside a long-term uptrend, and there is no death cross in sight.
- MACD: It made a lower low (-5.08) after the Nov 5 flush and has since curled up. The bullish signal-line cross is a mild improvement, but it is unconfirmed below zero.
- RSI: Price made a lower low on Nov 5 ($123.62) with an RSI low of 32.9. Since the bounce, RSI is making lower highs (49.1 vs the 60s earlier in the quarter). There is no clear bullish divergence.
- CMF: It has been trending negative since September. It did not confirm the price rebound toward $143, which is a bearish non-confirmation.
- ADX/DI: −DI has stayed above +DI for the last 15 bars, although the spread has narrowed. Weak ADX means follow-through in either direction needs a catalyst.
CHART PATTERNS
- On the daily chart, price has formed a broad consolidation after the post-IPO spike and a drawdown to about $105. It has been making higher lows ($105 → $123.6) and lower highs (about $175 → $149). That resembles a Symmetrical Triangle from the reference, which is a continuation pattern with a break either way. The flat-to-rolling SMA50 and VWAP overhead act as a lid.
- Distribution on CMF and −DI dominance tilt the breakout odds modestly to the downside. A break below $123.6 would target roughly $105–$110 (the prior swing low area and the EMA 200 rising toward $105 by January).
- An upside break above about $149–$156 would target the upper $160s to $175.
- The post-IPO high near $175–$180 and the later lower high form something like a Bearish Head and Shoulders / Double Top structure at the macro level. It is not confirmed, because the neckline near $123–$125 hasn't broken.
POTENTIAL SCENARIOS
- Scenario 1: Bearish Distribution Breakdown — Weak rallies fail at the SMA50/VWAP zone ($148–$149) and the Nov 5 low is retested, then lost as CMF stays negative and −DI dominates. Trigger: daily close below $123.60. Target: $110–$115, with an extension toward $105. Invalidation: daily close above $149 on rising volume and positive CMF. (45% probability)
- Scenario 2: Neutral Range Consolidation — Price keeps oscillating between the $124 support area and the $149–$156 resistance area, with ADX staying below 20. Trigger: failure to break $123.60 or $149 for several weeks. Target: $128–$145. Invalidation: close outside $123–$156. (30% probability)
- Scenario 3: Bullish Reclaim and Breakout — The MACD crossover follows through, price reclaims SMA50/VWAP at about $149 and breaks the upper Bollinger Band. Trigger: close above $149, then above $156.43. Target: $165–$175. Invalidation: close back below $135 after the breakout. (25% probability)
PRICE TARGETS
Range width: $152.00 − $117.00 = $35.00, which is 25.2% of the current price. This is consistent with the 18–30% guidance for a 61–180 day timeframe.
- Target Price: $131.00 (62 days, Jan 16, 2027)
- Expected Range: $117.00 to $152.00
- Key Levels: Support at $123.60, Resistance at $148.90
OVERALL BIAS
OVERALL BIAS: BEARISH - Price is below the EMA 50, SMA50D and VWAP. CMF shows persistent distribution (-0.17), −DI is above +DI, and rallies are failing below about $149. The fresh MACD crossover and the long-term uptrend above the EMA 200 limit conviction, but the evidence tilts toward a drift lower toward $131 with downside risk to $110.
This is educational analysis and not financial advice.