SPCX 48-day bearish forecast — Nov 15, 2026
- Bias: Bearish
- Timeframe: 48 days (made Nov 15, 2026, target date Jan 1, 2027)
- Price at analysis: $139.11
- Price target: $132.50
- Expected range: $121.00 – $143.00
- Result: Pending — graded after the close on Jan 1, 2027
Get a free AI analysis of SPCX today
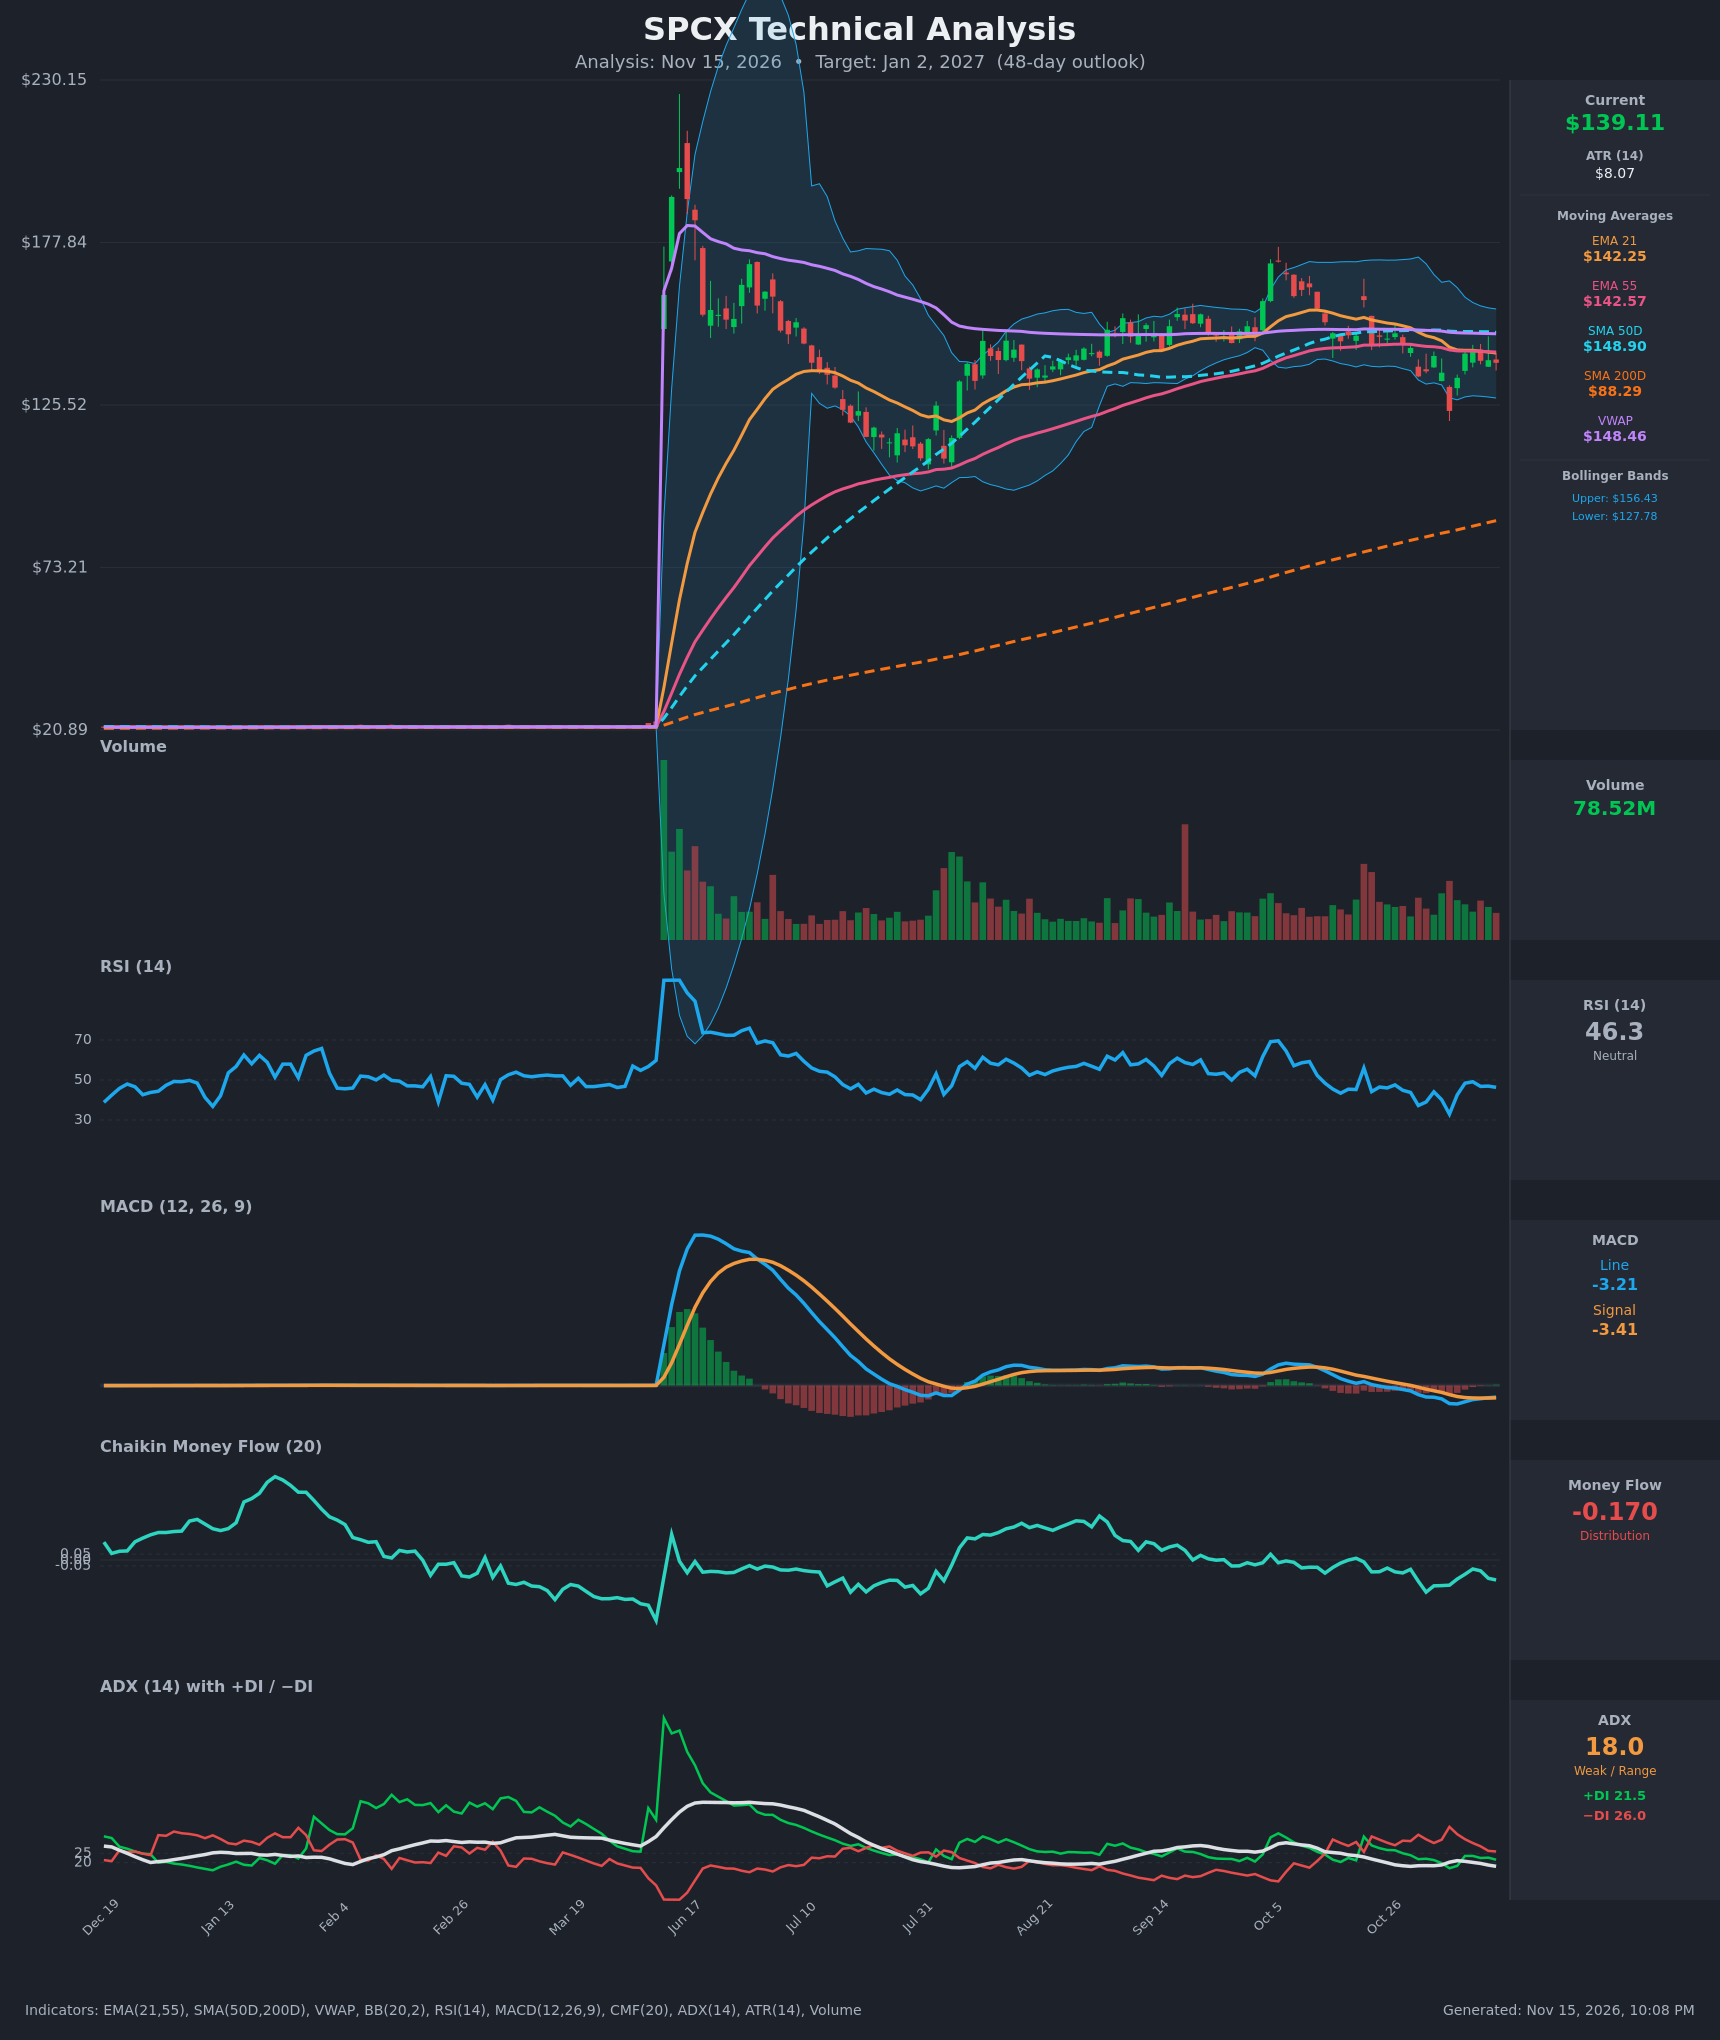
Analysis
TECHNICAL INDICATORS
- RSI (14): 46.32, just under the 50 midline. It bounced from 32.9 on Nov 5 to about 49 on Nov 10, then rolled over to 46. That is neutral momentum with a slight downward lean. [Neutral]
- 20 EMA: The data supplied is EMA 21 at $142.25. Price at $139.11 is below it, so it acts as resistance. EMA21 crossed below EMA55 ($142.57) on Nov 12, a fresh bearish crossover, though the gap is only about $0.32 and both averages are flat. [Bearish]
- MACD: Line -3.21 vs signal -3.41, so the histogram is slightly positive (about +0.20). The line crossed back above the signal on Nov 12-13 after a deep negative reading (-5.08 on Nov 6). Both lines remain below zero, so this is a weak bullish convergence inside a negative regime. [Neutral]
- Bollinger Bands (20): Upper $156.43, lower $127.78, midline about $142.10. Price sits in the lower half, below the midline, and the bands are moderately wide. The Nov 5 flush to $123.62 pierced the lower band and was bought back quickly. [Neutral]
- CMF (20): -0.170, well below -0.05. It has been negative for the whole 15-bar window, worsening from -0.08 to -0.17 to -0.27 at the low. This is sustained distribution and the clearest bearish signal on the chart. [Distribution]
- ADX (14): 18.0 (below 20, weak trend) with −DI 26.0 above +DI 21.5. Bears have held control throughout the window, but the weak ADX means the downtrend is not strong and price is mostly range-trading. [Weak Trend, bearish lean]
- Volume: 78.52M, around or modestly above the recent baseline. The Nov 5 capitulation and the Oct 30 drop came on above-average volume, and rebounds have been less convincing. That fits the CMF distribution reading. [Mildly bearish]
Moving-average context:
- Price is below EMA21, EMA55, SMA50D ($148.90) and VWAP ($148.46), so every short- and medium-term average sits overhead as resistance.
- Price is far above SMA200D ($88.29), and SMA50D is above SMA200D, a golden-cross configuration. SMA200D is distorted by the short post-IPO history, so give it little weight.
DIVERGENCES & TRENDS
- There is no clean RSI or MACD divergence. The Nov 5 low at $123.62 came with RSI at 32.9, and the later bounce was a lower-momentum recovery.
- Price made a high near $178 around Oct 5 and has since put in a series of lower highs ($148.58 on Oct 27, $143.09 on Nov 10), while CMF keeps deteriorating. This is mild bearish confirmation.
- EMA21 crossed below EMA55 on Nov 12, and SMA50D has started to roll over ($149.68 to $148.90).
- The MACD line crossing back above the signal is the one counter-signal, but it occurred below zero and is the type that often fails.
- ADX is under 20 with −DI on top. A drift lower is more likely than a sharp trend.
CHART PATTERNS
- Since the post-IPO spike, the structure is a wide consolidation between about $123 and $178, now compressing into a range of roughly $125 to $155.
- The lower highs from the Oct peak with a defended low near $123.6 resemble a Symmetrical Triangle or a loose Descending Triangle. Neither is confirmed, and the reference diagram's triangle patterns require clearer converging trendlines.
- A bearish resolution would need a close below the Nov 5 low (about $123.6). The measured move would then be roughly the pattern height, toward the $105-$110 area, which matches the July-August base.
- A Double Top is not valid here, since only one clear peak exists.
- A bullish break would need a reclaim of about $148-$150, the SMA50 and VWAP cluster.
POTENTIAL SCENARIOS
- Scenario 1: Bearish Drift Toward the Range Lows — Price is capped by the EMA21/55 cluster (about $142.5) and the SMA50/VWAP (about $148-149). CMF distribution and −DI dominance keep pressure on, and price retests the lower Bollinger band. Trigger: rejection at $142-143 and a close below $135. Target: $127-$132, with an extension to $123.6. Invalidation: daily close above $149. (50% probability)
- Scenario 2: Neutral Range Chop — ADX stays under 20 and price oscillates between about $127 and $148 as the MAs flatten. Trigger: failed breaks on both sides of the range. Target: $135-$145. Invalidation: close below $123.6 or above $150. (28% probability)
- Scenario 3: Bullish Recovery — The MACD bullish convergence follows through, CMF turns up, and price reclaims the EMAs and then the SMA50/VWAP. Trigger: close above $143 on rising volume with CMF back above 0. Target: $150-$156 (upper band). Invalidation: close back below $135. (22% probability)
PRICE TARGETS
Expected range width: $143.00 - $121.00 = $22.00, or about 15.8% of $139.11. This fits the 30-60 day guidance of 12-18%.
- Target Price: $132.50 (48 days)
- Expected Range: $121.00 to $143.00
- Key Levels: Support at $127.78 (lower Bollinger Band, with $123.62 as the next swing low), Resistance at $142.57 (EMA55, with the EMA21 just below it)
OVERALL BIAS
OVERALL BIAS: BEARISH - Price sits below all key short- and medium-term averages after a fresh EMA21/55 bearish cross, CMF shows persistent distribution (-0.17), and −DI stays above +DI. The MACD uptick and weak ADX keep conviction modest, so the expected move is a drift toward the lower range ($127-$132) rather than a collapse.
This is educational analysis and not financial advice.