SPCX 20-day bearish forecast — Nov 15, 2026
- Bias: Bearish
- Timeframe: 20 days (made Nov 15, 2026, target date Dec 4, 2026)
- Price at analysis: $139.11
- Price target: $134.50
- Expected range: $122.00 – $147.50
- Result: Pending — graded after the close on Dec 4, 2026
Get a free AI analysis of SPCX today
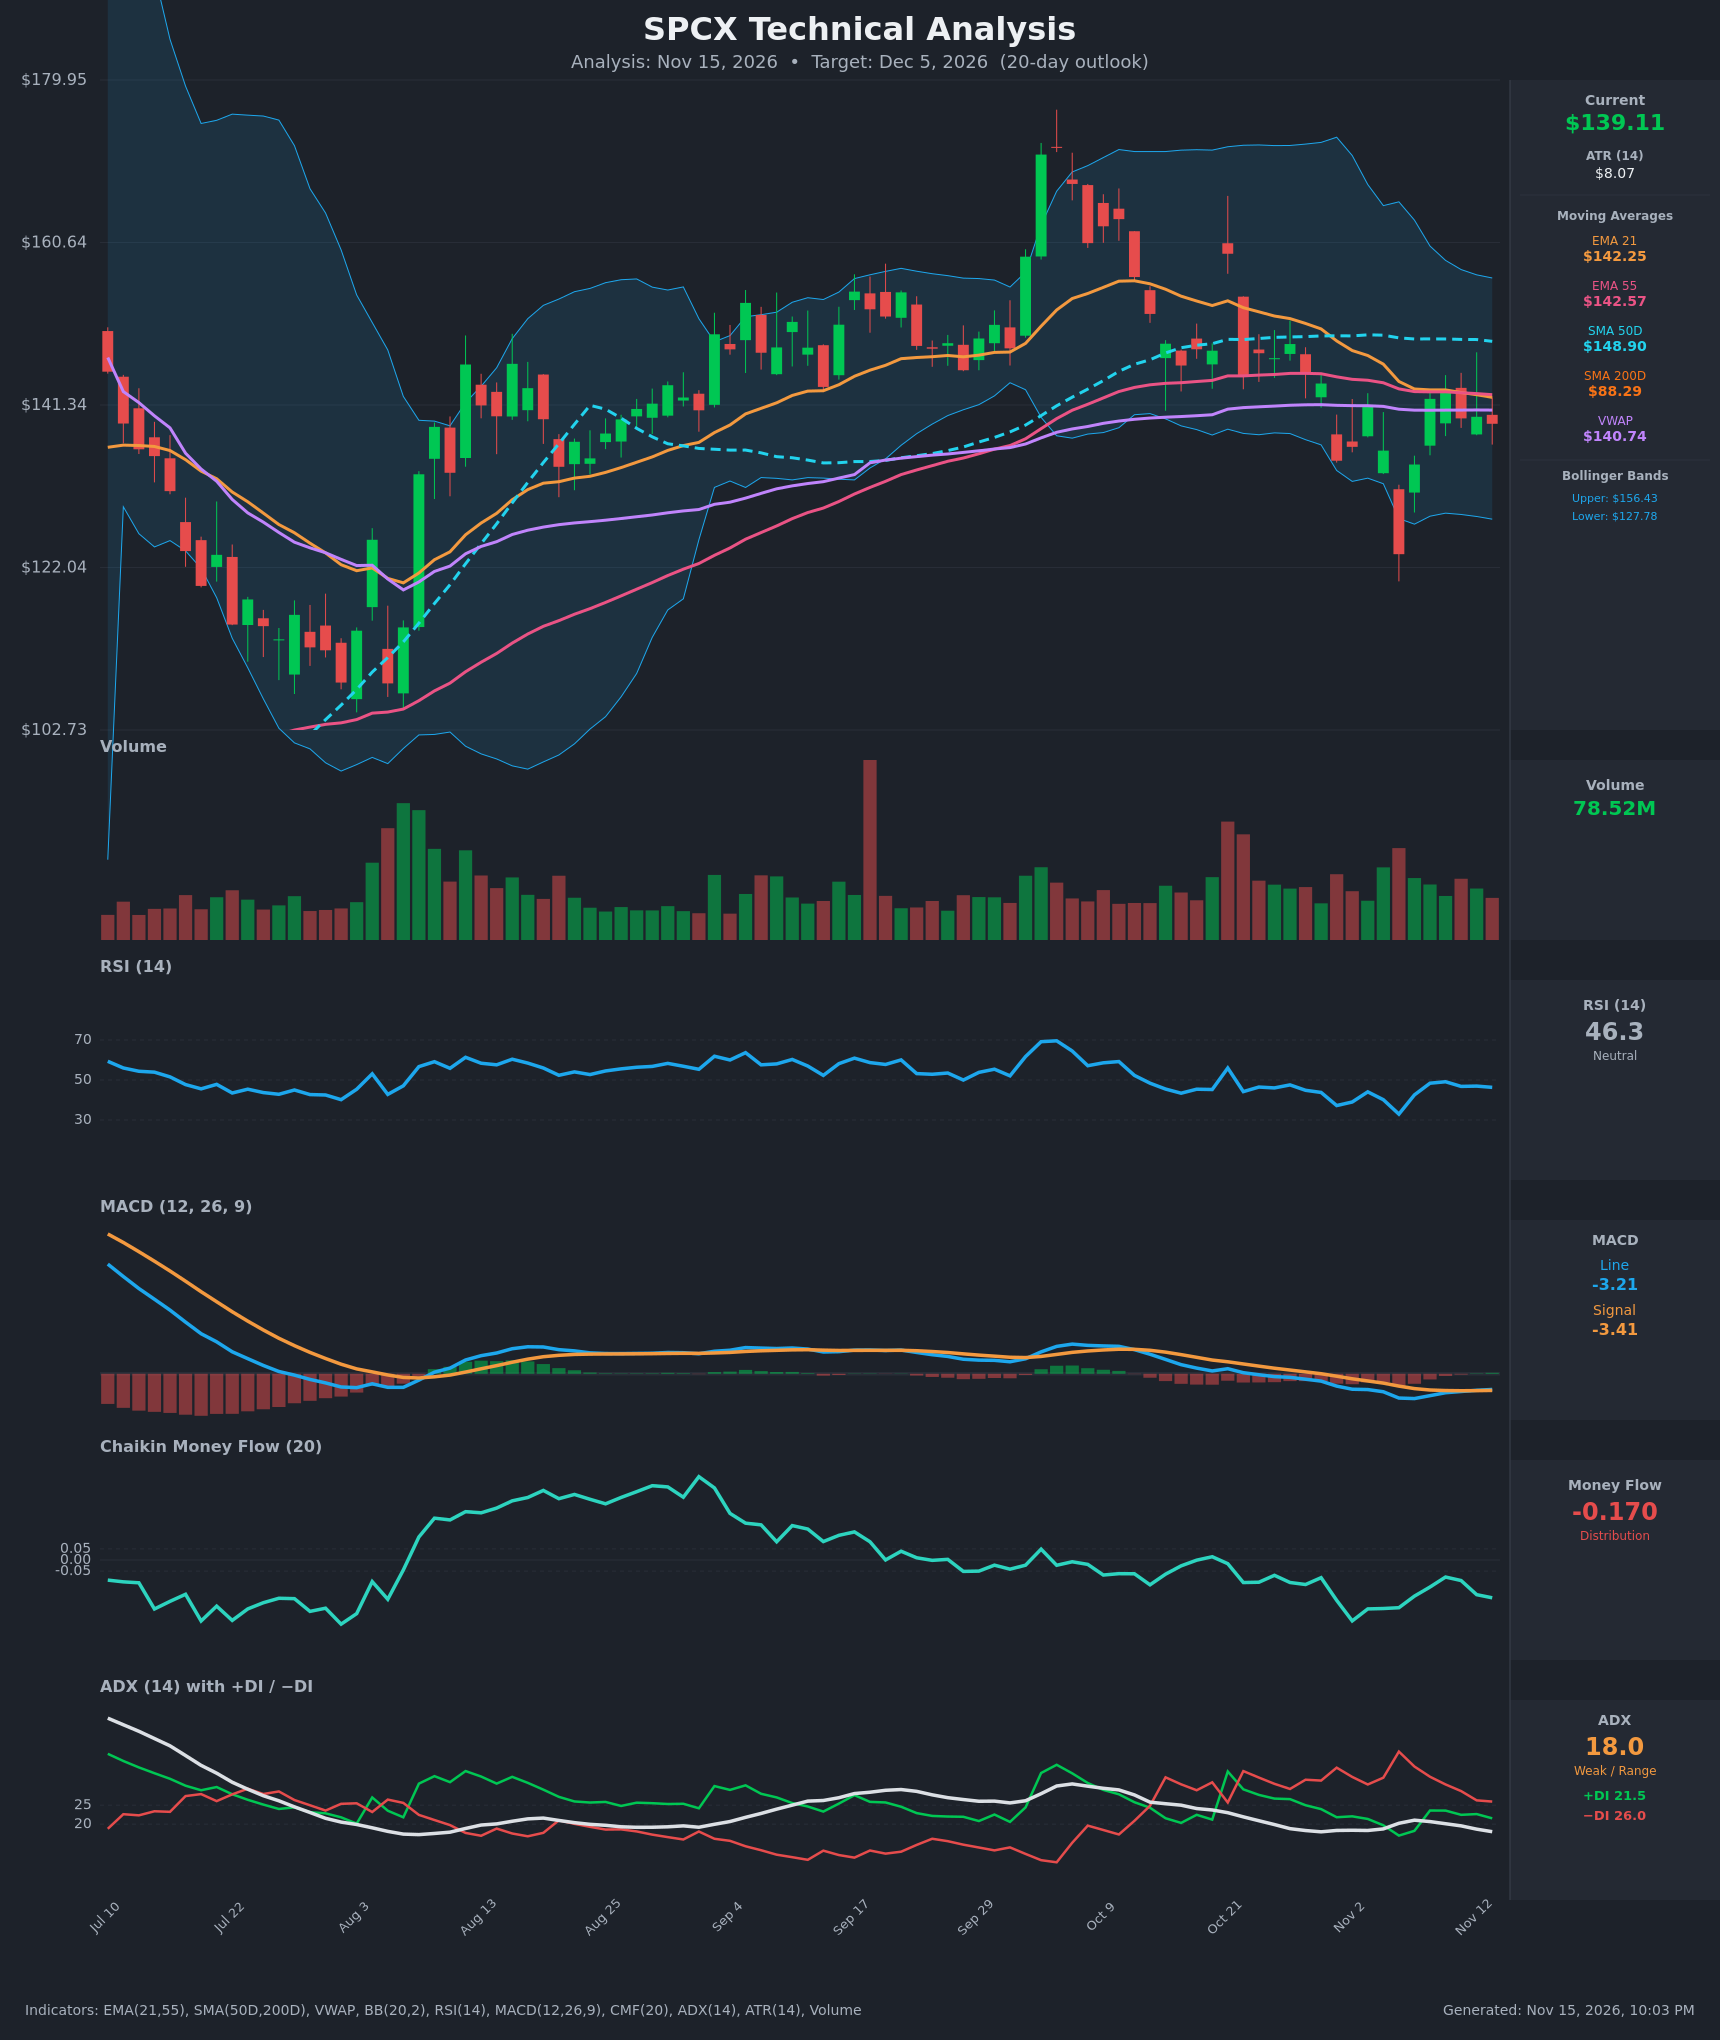
Analysis
TECHNICAL INDICATORS
- RSI (14): 46.32, just under the 50 midline. It bounced from 32.9 (Nov 5) to about 49 (Nov 10) and has rolled over to 46. Momentum is neutral to slightly soft, with no oversold or overbought reading. [Neutral]
- 20 EMA: The EMA 21 is $142.25 and price at $139.11 is below it, so it acts as resistance. EMA 21 has crossed below EMA 55 ($142.57) and is still falling, a fresh bearish crossover. Price has failed to hold above the EMAs after the Nov 9–10 bounce. [Bearish]
- MACD: Line -3.21 is above Signal -3.41, a small positive histogram of about +0.20 after a bullish crossover around Nov 12. Both lines are still well below zero, so this is a weak bounce inside a bearish regime rather than a trend change. [Neutral]
- Bollinger Bands (20): Upper $156.43, lower $127.78, midline about $142.10. Price is below the midline in the lower half of the bands. The bands have narrowed from the Oct highs, and the Nov 5 wick below the lower band was bought back quickly. [Neutral]
- CMF (20): -0.170, well below -0.05 and negative for several weeks, with a low of -0.274. Selling pressure dominates and there is no sign of accumulation yet. [Distribution]
- ADX (14): 18.0, below 20, so the trend is weak or range-bound. -DI (26.0) is above +DI (21.5), a mild bearish bias, but the gap is narrowing from the Nov 5 extreme (39.1 vs 17.0). [Weak Trend, Bearish lean]
- Volume: 78.52M, roughly in line with recent averages. The biggest recent volume spikes came on red candles (Oct 21–Nov 5 selloff), while the bounce volume is only moderate. This confirms distribution rather than a strong rebound. [Mildly Bearish]
DIVERGENCES & TRENDS
- No clear divergences: RSI made a higher low (32.9 on Nov 5 vs 37.2 on Oct 30) while price made a lower low ($123.62 vs $134.72), which is a minor bullish divergence. It has not been confirmed by a break higher.
- Trend: SMA50D at $148.90 is flattening and declining slightly, and price is below it. SMA200D at $88.29 is far below, so the long-term trend is still up, but the intermediate trend has turned down from the $170 spike in early Oct.
- Crossovers: EMA21 crossed below EMA55 (bearish), MACD crossed up above its signal (minor bullish), and −DI stays above +DI. Price sits just under VWAP ($140.74) and the EMAs, which now form a $140.7–$142.6 resistance cluster.
- CMF has been trending down since the Aug–Sep peak and has not recovered above zero, which is a persistent bearish divergence from the earlier price highs.
CHART PATTERNS
- Possible Bearish Head and Shoulders / lower-high structure: The Sep–Oct spike to about $170 is the head, with lower highs near $152 in late Oct. The neckline sits around $122–$127, tested on Nov 5. A breakdown below $122 would project toward roughly $100–$105 (head-to-neckline depth).
- Developing range or small symmetrical triangle: Since Nov 9, price has been compressing in a $134–$143 range with weak ADX. This could be a consolidation after the sharp drop (bearish pennant-like), whose resolution favors continuation down given CMF and DI.
- Alternatively a Bullish Double Bottom near $123–$135 (Oct 30 and Nov 5 lows), but it would need a close above about $143–$149 to confirm, and the evidence so far does not support it.
POTENTIAL SCENARIOS
- Scenario 1: Bearish Rollover Within Range — Price fails at the $142–$143 EMA/VWAP cluster. Negative CMF and −DI dominance push it back toward the lower Bollinger Band. Trigger: close below $135 on rising volume. Target: $128–$130, with an extension to $123. Invalidation: daily close above $144 (EMA 55 and VWAP reclaimed). (50% probability)
- Scenario 2: Neutral Range Chop — Weak ADX keeps price between about $130 and $145 as the bands tighten and MACD hovers near its signal. Trigger: failed breakouts on both sides. Target: $135–$142. Invalidation: close above $145 or below $130. (22% probability)
- Scenario 3: Bullish Recovery — The MACD cross and RSI higher low lead to a reclaim of the EMAs and a move toward the SMA50 and upper band. Trigger: close above $144 with CMF turning toward zero. Target: $149–$152. Invalidation: close below $133. (28% probability)
PRICE TARGETS
- Target Price: $134.50 (20-day, Dec 5, 2026)
- Expected Range: $122.00 to $147.50 (width $25.50, about 18.3% of current price, consistent with a 14–30 day horizon of roughly 12–18%)
- Key Levels: Support at $127.78 (lower Bollinger Band, with $123.62 as the next swing low), Resistance at $142.57 (EMA 55, with EMA 21, VWAP and the midline clustered at $140.7–$142.3)
OVERALL BIAS
OVERALL BIAS: BEARISH - Price is below the EMA 21/55 cluster after a bearish EMA cross, CMF is deeply negative (-0.170) with −DI above +DI, and volume has been heavier on selloffs. The MACD bounce is shallow and below zero, so the path of least resistance over 20 days is a drift toward the $128–$135 area.
This is educational analysis and not financial advice.