SPCX 27-day bearish forecast — Nov 15, 2026
- Bias: Bearish
- Timeframe: 27 days (made Nov 15, 2026, target date Dec 11, 2026)
- Price at analysis: $139.11
- Price target: $134.50
- Expected range: $124.00 – $145.00
- Result: Pending — graded after the close on Dec 11, 2026
Get a free AI analysis of SPCX today
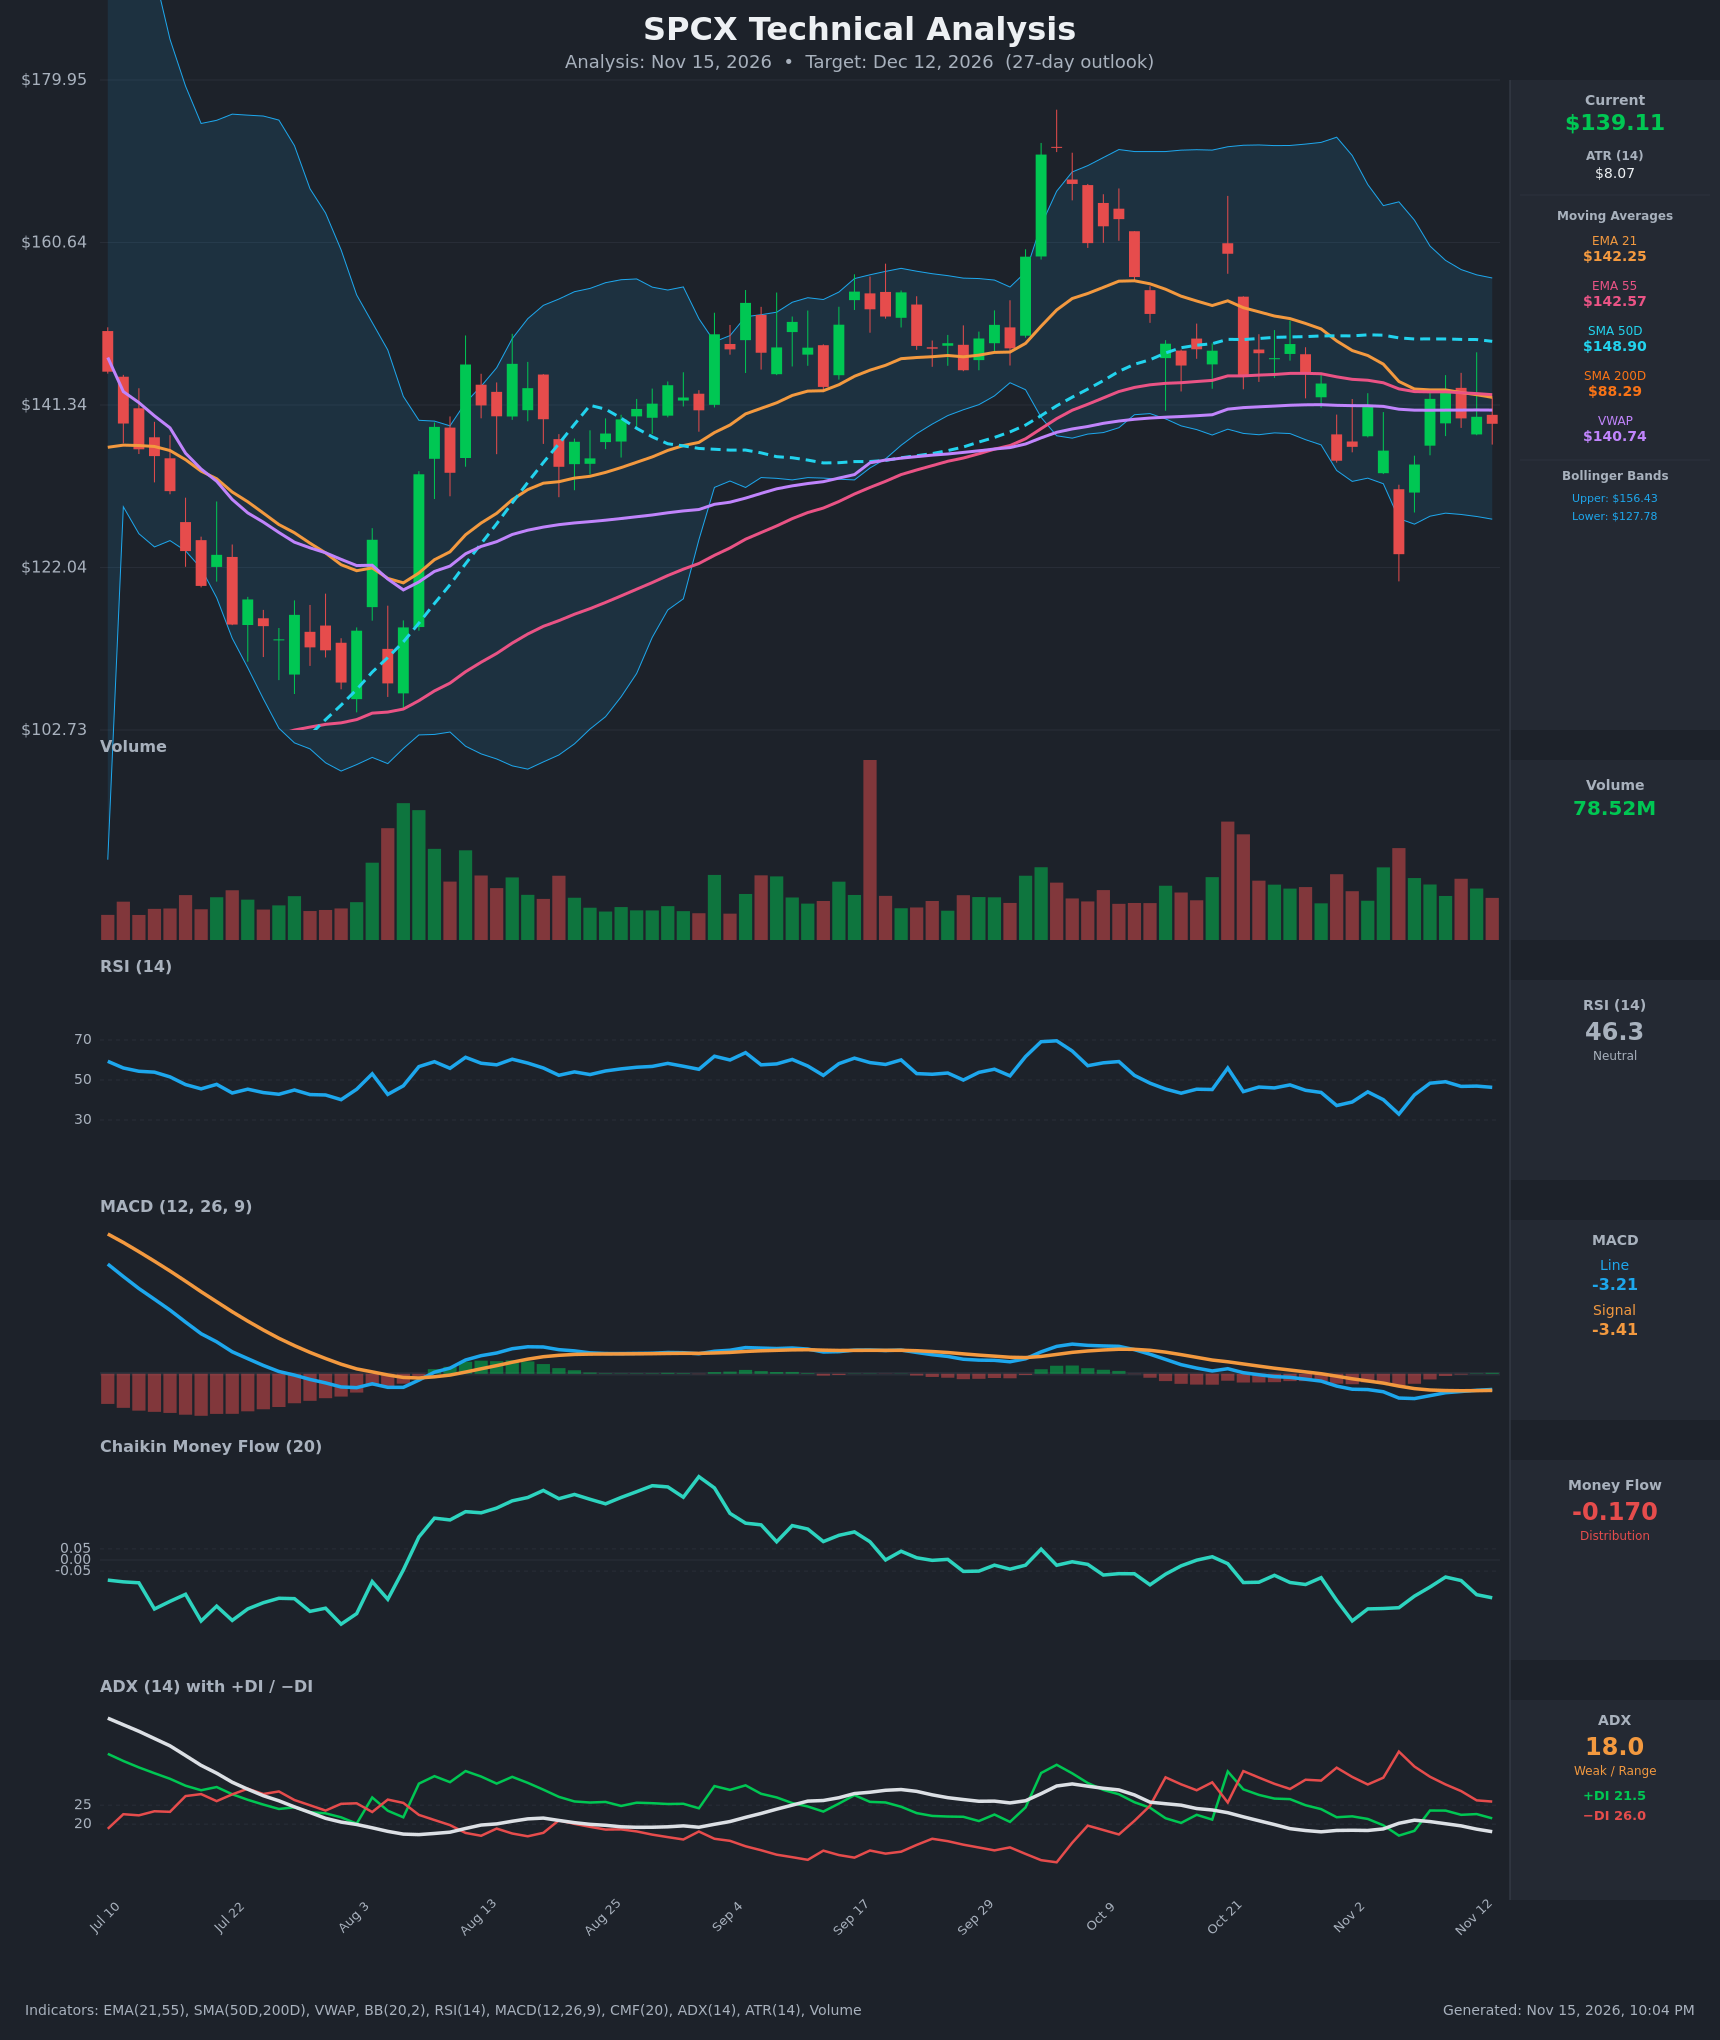
Analysis
TECHNICAL INDICATORS
- RSI (14): 46.32, just under the 50 midline and well off the Nov 5 low of 32.9. It has been flat between 46 and 49 for the last five sessions. This shows momentum recovering from oversold but not yet regaining bullish control. [Neutral]
- 20 EMA: The 21 EMA is $142.25 and price ($139.11) is below it. It is sloping down from $151.9 on Oct 26. The 21 EMA has also crossed below the 55 EMA ($142.57), a minor bearish crossover on Nov 12. Both averages are now overhead resistance. [Bearish]
- MACD: The line (-3.21) is just above the signal (-3.41), so the histogram is slightly positive and has been improving for about 4 sessions. This is a tentative bullish crossover, but both lines are still well below zero and the move is small. [Neutral]
- Bollinger Bands (20): Upper $156.43, lower $127.78, midline about $142.1. Price sits in the lower half of the bands, below the mid-band, with bands still wide after the October volatility. There is no squeeze or band-walk. Price is capped by the midline, with room down to $127.78. [Bearish]
- CMF (20): -0.170, well below the -0.05 threshold and drifting lower after a brief recovery (-0.077 on Nov 10). This shows persistent distribution and selling pressure into rallies. [Distribution]
- ADX (14): 18.0, below 20 and drifting down, with −DI (26.0) above +DI (21.5). The trend is weak or range-bound, with a mild bearish tilt in directional control. The −DI/+DI gap has been narrowing since Nov 5, though −DI is still on top. [Weak Trend, bearish lean]
- Volume: 78.52M, roughly average with no climactic spike. The Nov 5 selloff (-9% to $123.62) came on heavy volume, while the rebound candles were on lighter volume. There is no confirmed accumulation. [Neutral-to-bearish, rebound lacks conviction]
- VWAP / SMAs (supplementary): Price is below VWAP ($140.74) and below the 50-day SMA ($148.90, declining). It is far above the 200-day SMA ($88.29), so the long-term uptrend is intact (the golden cross is long established). [Mixed: short-term bearish, long-term bullish]
DIVERGENCES & TRENDS
- No clear divergence: RSI made a higher low on Nov 13 (46.3) than a price-based low would imply, but price has not made a new low since Nov 5, so there is no actionable divergence.
- Momentum: MACD histogram is turning up from its Nov 6 trough (-5.08), a sign of bearish momentum fading.
- Money flow: CMF is trending lower and stays negative since early October, which does not support a durable rally.
- Crossovers:
- 21 EMA crossed below the 55 EMA (Nov 12).
- Price is below all key moving averages.
- MACD has a minor bullish cross.
- −DI remains above +DI.
- Trend structure: Lower highs since the October spike (~$172 → ~$160 → ~$153 → ~$148) with a swing low at $123.62. The 50-day SMA is rolling over from $149.7.
CHART PATTERNS
- Descending-triangle / bear-flag style structure: Since the October peak, price has made a series of lower highs while the $122-$124 zone (Nov 5 low) has been defended. The most relevant patterns from the reference are the Descending Triangle and the Bearish Flag/Pennant. A decisive close below about $123 would target roughly $105-$110 (the measured move from the triangle height). That is beyond the 27-day base case.
- Rebound from the Nov 5 low: The bounce is shallow and capped at the 21/55 EMA cluster (~$142.5), which fits a relief rally inside a lower-high sequence rather than a reversal.
- No confirmed Bullish Double Bottom: The Oct 30 and Nov 5 lows are not clean enough, and a break above about $148 would be needed to take the bullish case seriously.
POTENTIAL SCENARIOS
- Scenario 1: Bearish Rejection at EMA Cluster — Price fails at the 21/55 EMA zone and VWAP (~$140.7-$142.6). Persistent distribution (CMF -0.17) and −DI dominance drive a drift lower toward the lower Bollinger Band. Trigger: rejection at $142.5 and a close below $135. Target: $127-$132, with an extension to $123.6. Invalidation: daily close above $148.9 (50-day SMA). (45% probability)
- Scenario 2: Neutral Range Consolidation — With ADX below 20, price chops between roughly $127 and $145 around the flat EMAs and VWAP. Trigger: failure to break either $127.8 or $145. Target: $135-$142. Invalidation: close outside the $127-$148 band. (30% probability)
- Scenario 3: Bullish Relief Rally — The MACD crossover and the RSI recovery lead to a break above the EMA cluster, with a push toward the 50-day SMA and the upper band. Trigger: close above $143 on rising volume with CMF turning toward zero. Target: $148.9-$156. Invalidation: loss of $134. (25% probability)
PRICE TARGETS
- Target Price: $134.50 (27-day target, about -3.3% from $139.11)
- Expected Range: $124.00 to $145.00 (width $21.00 = about 15.1% of current price, consistent with the 27-day guidance of ~12-18%)
- Key Levels: Support at $127.78 (lower Bollinger Band; below that, $123.62 swing low), Resistance at $142.57 (55 EMA; above that, $148.90 50-day SMA)
OVERALL BIAS
OVERALL BIAS: BEARISH - Price is below the 21/55 EMAs, VWAP and the declining 50-day SMA, CMF shows heavy distribution (-0.17), and −DI leads +DI. The modest MACD upturn and weak ADX limit conviction, so the expected decline is moderate, toward about $134.50.
This is educational analysis and not financial advice.