SPCX 6-day bullish forecast — Nov 8, 2026
- Bias: Bullish
- Timeframe: 6 days (made Nov 8, 2026, target date Nov 13, 2026)
- Price at analysis: $134.19
- Price target: $137.00
- Expected range: $130.50 – $139.50
- Result: Correct (+1.6%) — closed at $136.30 on Nov 13, 2026; quality score 100/100
Get a free AI analysis of SPCX today
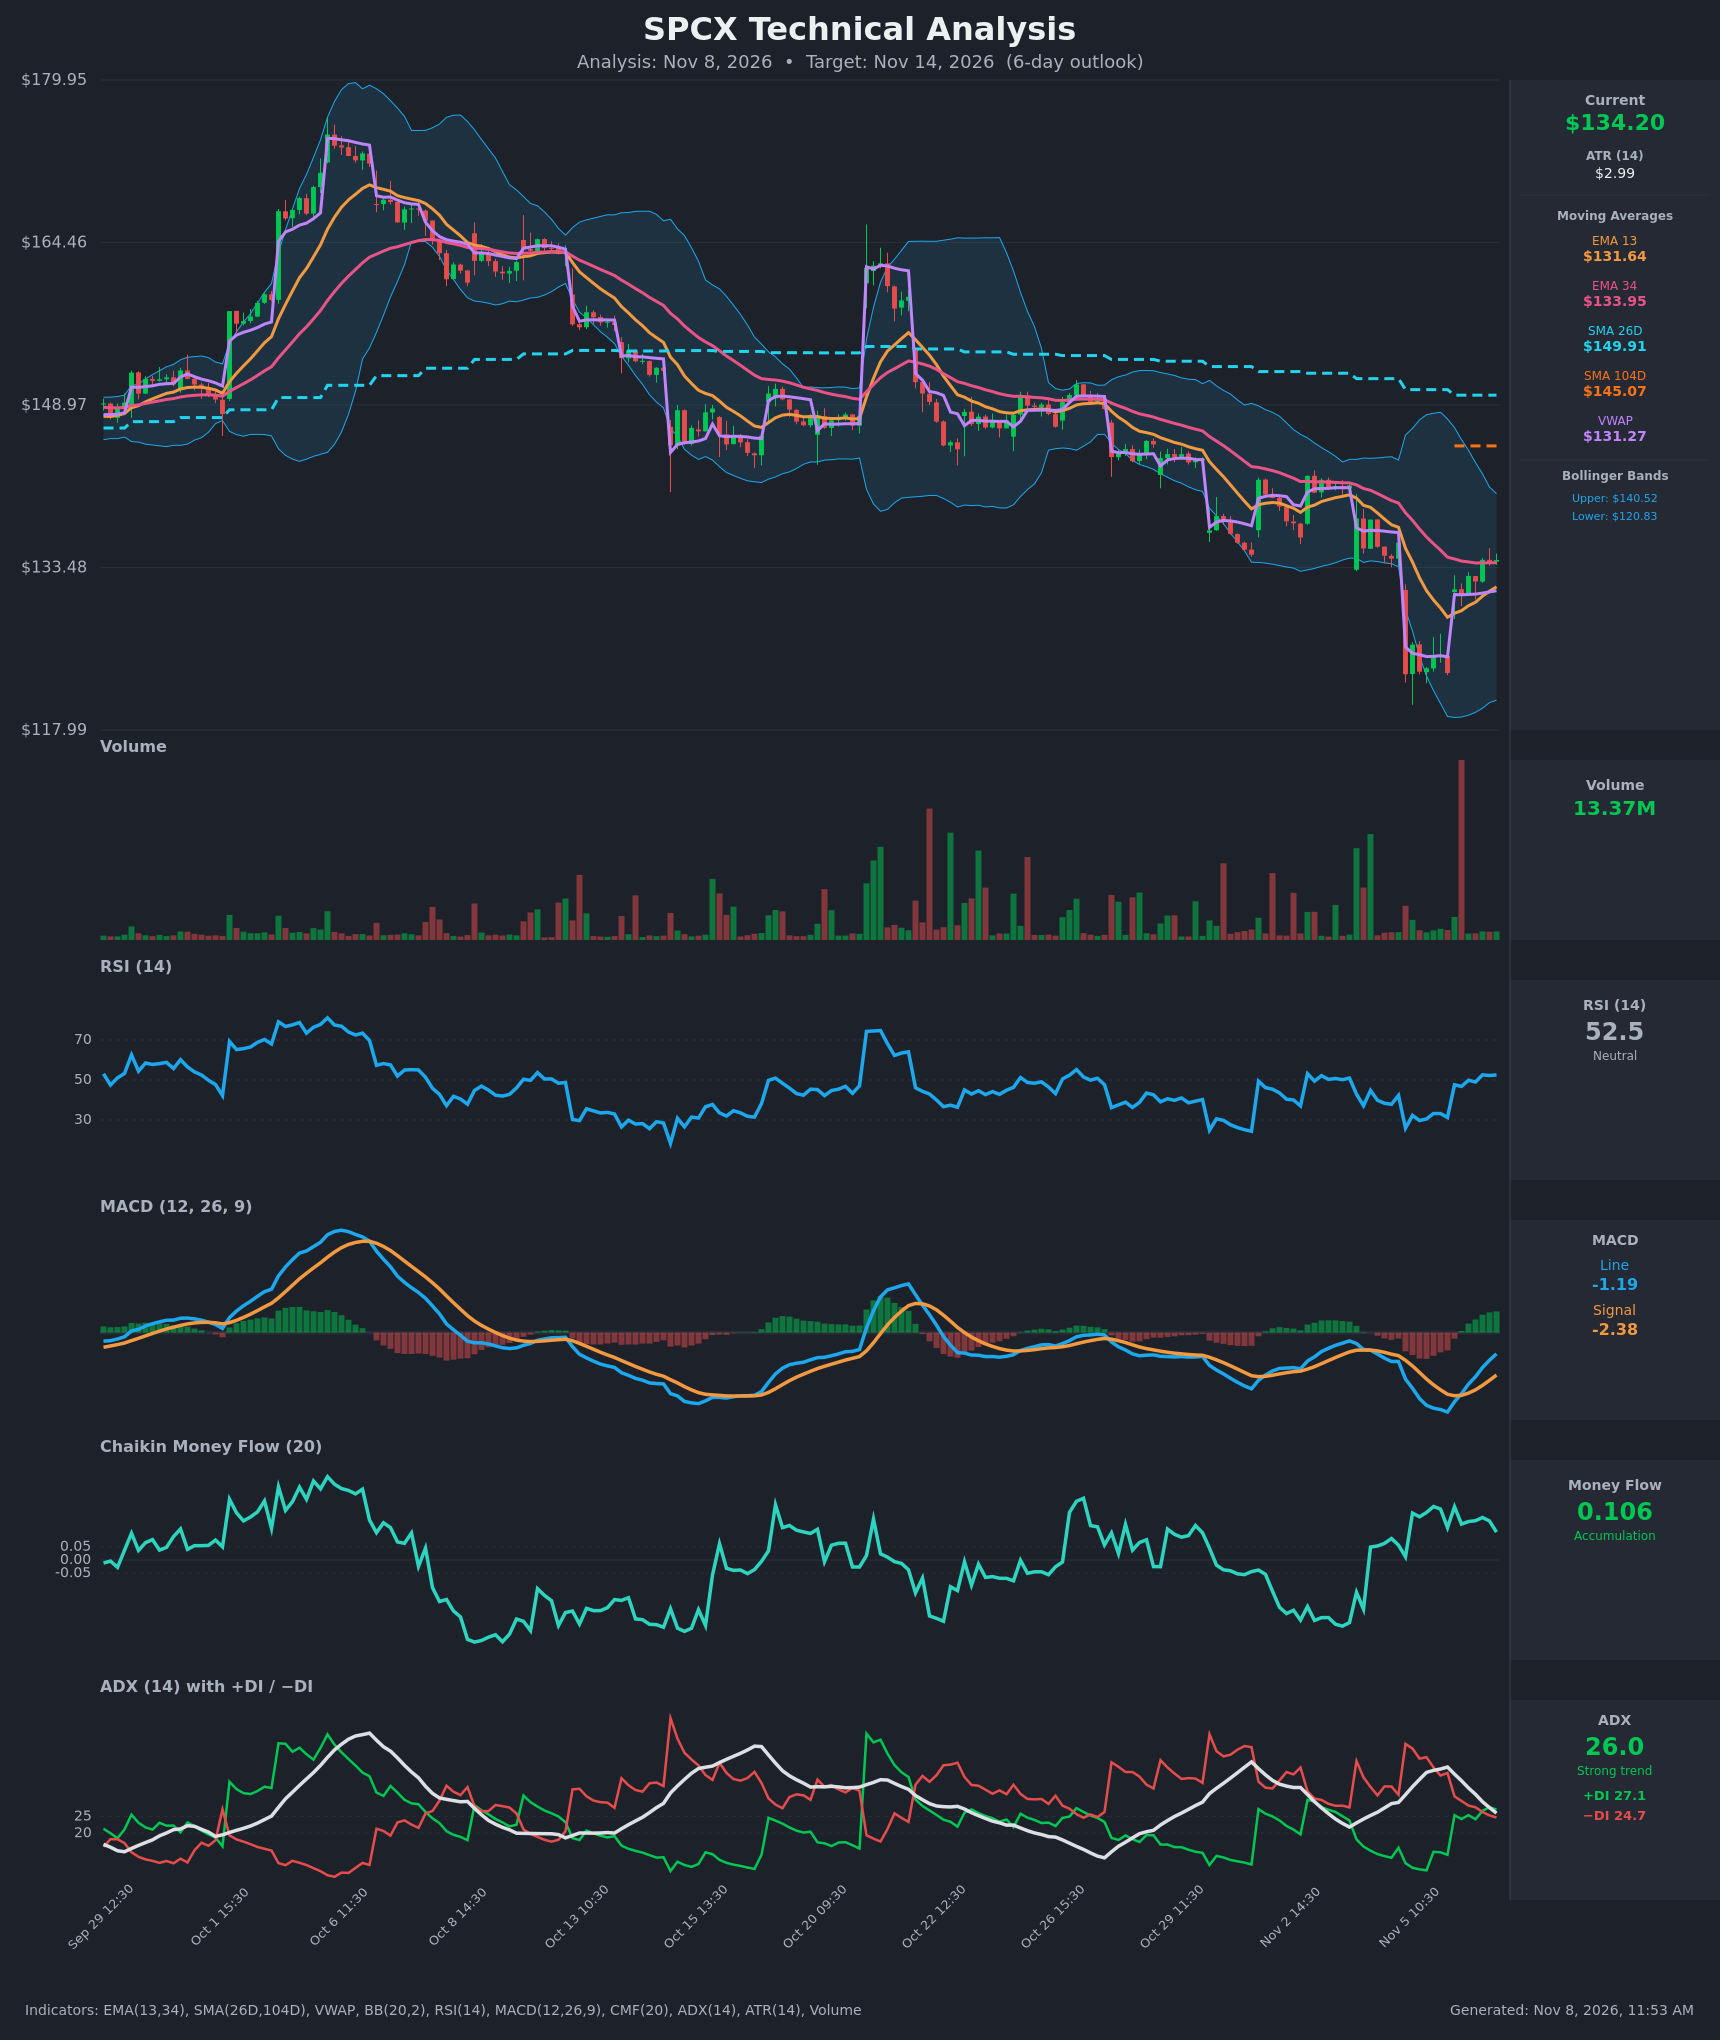
Analysis
TECHNICAL INDICATORS
- RSI (14): 52.53, up from the 25.9 capitulation low on Nov 5 and now back above the 50 midline. Momentum is recovering but not stretched. [Bullish]
- 20 EMA (13/34 on this chart): Price at $134.20 is above EMA13 ($131.64) and just above EMA34 ($133.95). EMA13 is rising but still below EMA34, so there is no bullish EMA crossover yet. The EMA34 is flat and acting as the immediate test. [Bullish]
- MACD: Line -1.195 versus signal -2.383. The line crossed above the signal around Nov 6 10:30 and the histogram is positive and widening. Both lines are still below zero, so this is a recovery rather than a confirmed trend change. [Bullish]
- Bollinger Bands (20): Upper $140.52, lower $120.83, midline about $130.70. Price has moved from the lower band back above the midline, and the bands are still wide after the volatility spike. The upper band at about $140.5 is the natural 6-day ceiling. [Bullish]
- CMF (20): 0.106, above the +0.05 threshold and positive through the bounce, so buying pressure persisted even during the selloff. [Accumulation]
- ADX (14): 26.0 and falling from about 39.8, so the downtrend is losing strength. +DI (27.1) has crossed above −DI (24.7), which gives bulls a slight edge, but the gap is small. [Weakening Trend, bullish DI tilt]
- Volume: 13.37M on the latest bar, much lower than the huge spike on the Nov 5 gap-down. The bounce has come on moderate, steady volume. Selling has been absorbed, but there is no strong breakout participation yet. [Neutral to mildly constructive]
Moving-average context: price is below SMA26D ($149.91) and SMA104D ($145.07), so the longer-term trend is still down. SMA26D is above SMA104D, so there is no death cross, but both averages are well overhead as resistance. Price is above VWAP ($131.27), which signals intraday buyer control.
DIVERGENCES & TRENDS
- The RSI low of 25.9 on Nov 5 came with a price low near $123. The RSI has since recovered faster than price, which is a classic oversold bounce, not a confirmed bullish divergence.
- The MACD bullish crossover came from deeply negative territory, and the histogram has flipped from red to green.
- +DI crossing above −DI while ADX declines suggests the bearish impulse is exhausting.
- The EMA13 gap-up from the lows shows rapid short-term recovery. Price is still making lower highs on the larger swing structure since the Oct 20 spike.
- CMF stayed positive during the decline, a mild hidden-accumulation signal.
CHART PATTERNS
- The reference diagram has no clean match. The structure is a V-shaped recovery after a capitulation gap, sitting inside a broader descending channel of lower highs (Oct 20 to Nov 5). It loosely resembles the bullish falling wedge/downtrend-exhaustion family.
- The first major hurdle is the $138–$141 zone, near the Nov 4 breakdown area and the upper Bollinger Band.
- A move above $141 would put the $145 SMA104D in play. Failure at EMA34/$135–$136 would turn the bounce into a dead-cat bounce.
POTENTIAL SCENARIOS
- Scenario 1: Bullish Relief Rally Extension — Price clears EMA34 and the lower-high structure and grinds toward the upper Bollinger Band as MACD and CMF stay supportive. Trigger: hourly close above $136 on steady volume. Target: $139–$141. Invalidation: close below $131 (EMA13/VWAP). (50% probability)
- Scenario 2: Bearish Failed Bounce — Sellers defend the EMA34 and the declining resistance, and the bounce rolls over back toward the gap-down lows. Trigger: rejection at $135–$136 and a MACD re-cross below signal. Target: $125–$128. Invalidation: hourly close above $138. (30% probability)
- Scenario 3: Neutral Consolidation — Price chops between the VWAP/EMA13 and EMA34/upper-band zone while ADX fades below 20. Trigger: failure to break either $131 or $138. Target: $132–$136. Invalidation: close outside $130–$139. (20% probability)
PRICE TARGETS
- Target Price: $137.00 (6-day outlook)
- Expected Range: $130.50 to $139.50 (width $9.00, about 6.7% of current price, consistent with the 6-day guidance of roughly 4–8%)
- Key Levels: Support at $131.64 (EMA13, with VWAP just below at $131.27), Resistance at $140.52 (upper Bollinger Band)
OVERALL BIAS
OVERALL BIAS: BULLISH - MACD has crossed up with a positive histogram, +DI is above −DI, CMF shows accumulation, and price is above VWAP and EMA13 after an oversold RSI reset. Conviction is modest because price remains below the SMA26D and SMA104D and is only just above the EMA34, which is the key near-term test.
This is educational analysis and not financial advice.