SMCI 4-day bullish forecast — Nov 8, 2026
- Bias: Bullish
- Timeframe: 4 days (made Nov 8, 2026, target date Nov 11, 2026)
- Price at analysis: $28.76
- Price target: $29.10
- Expected range: $28.00 – $29.60
- Result: Correct (+5.8%) — closed at $30.43 on Nov 11, 2026; quality score 61/100
Get a free AI analysis of SMCI today
Analysis
TECHNICAL INDICATORS
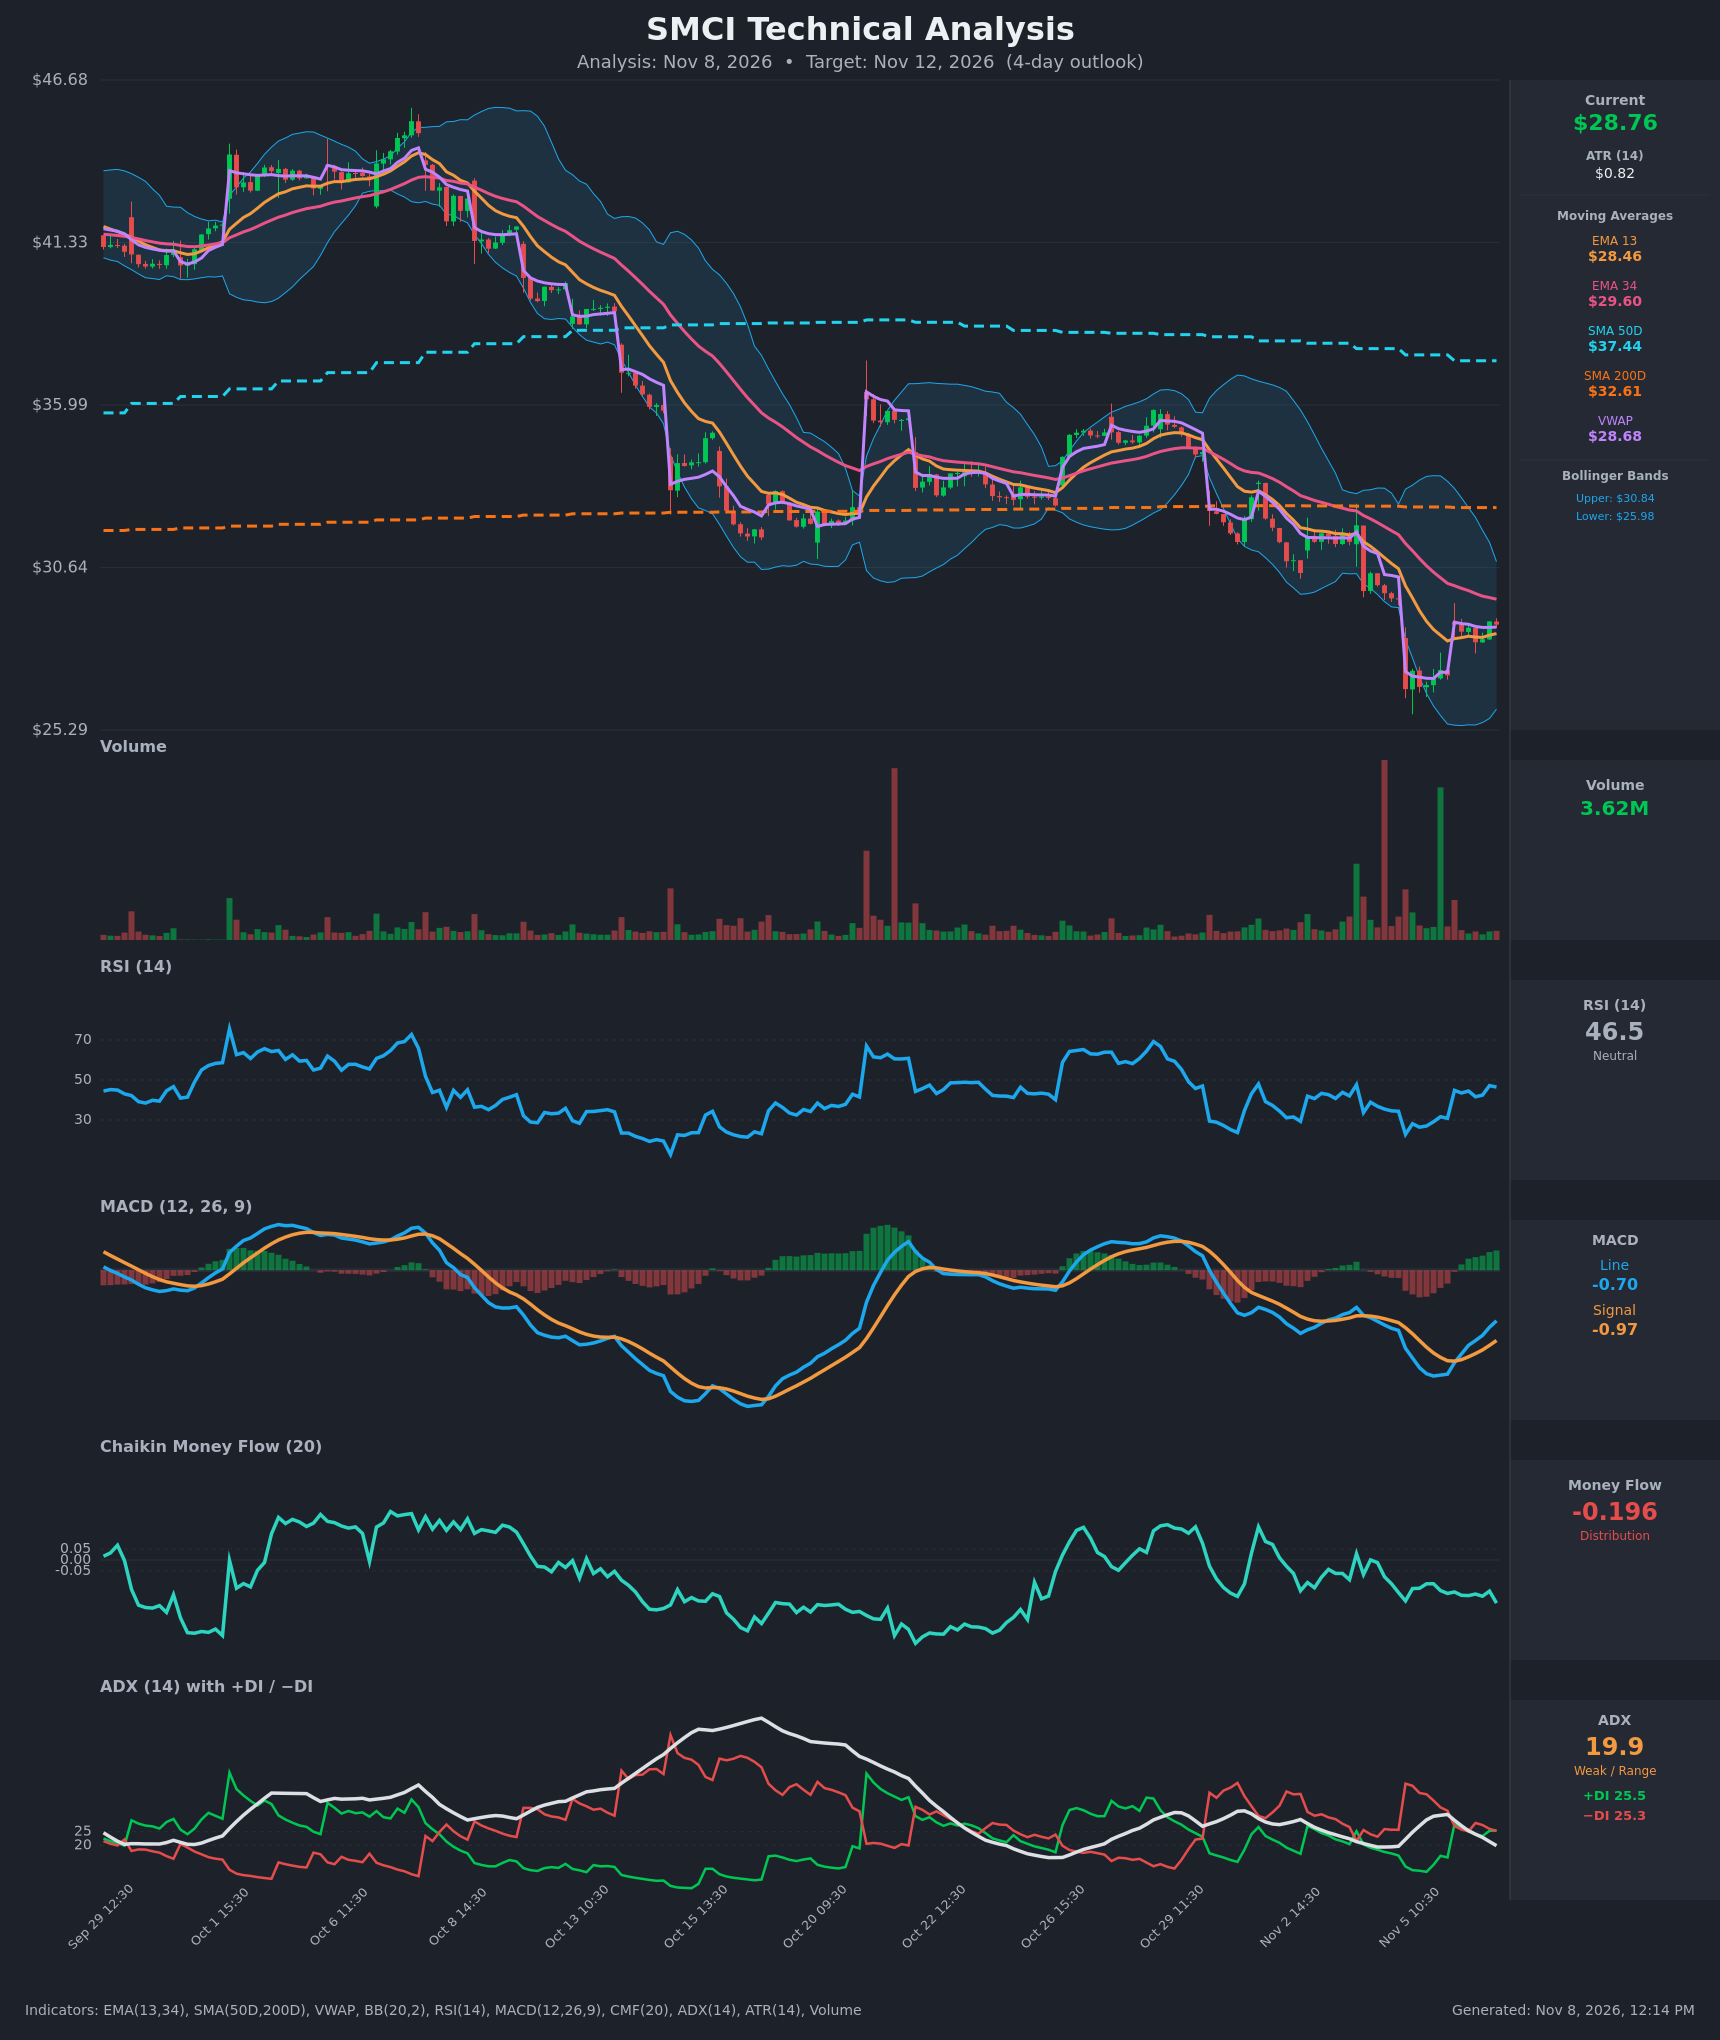
- RSI (14): 46.46, up from a capitulation low of 22.8 on Nov 5 and now back near the midline. Momentum is recovering but has not yet crossed 50. [Neutral]
- 20 EMA: The data gives EMA 13 at $28.46 and EMA 34 at $29.60, so I'm using the EMA 13 as the fast-average proxy. Price ($28.76) is above EMA 13, which is acting as support. EMA 13 is still below EMA 34 (no bullish crossover), and the EMA 34 at $29.60 is overhead resistance. [Neutral]
- MACD: Line -0.70 vs signal -0.97. The line crossed above the signal around Nov 6 10:30 and the histogram has flipped positive and is widening. The crossover is a bullish momentum shift, but it is still below zero. [Bullish]
- Bollinger Bands (20): Upper $30.84, lower $25.98, middle about $28.41. Price is just above the midline after bouncing off the lower band. The bands are wide, which reflects the recent volatility spike, and price is no longer at an extreme. [Neutral]
- CMF (20): -0.196, well below -0.05 and showing no real improvement. Selling pressure is still dominant and the bounce lacks accumulation support. [Distribution]
- ADX (14): 19.9 and falling from 31 on Nov 5, with +DI 25.5 and −DI 25.3. The prior bearish trend has lost strength and the DIs have converged, so there is no directional control. [Weak Trend, no clear direction]
- Volume: 3.62M on the latest bar, which is modest and below the heavy-volume capitulation bars of Nov 4-5. The bounce is occurring on light volume, so the relief rally is unconfirmed. [Neutral to slightly bearish]
DIVERGENCES & TRENDS
- Price is making a higher low versus the Nov 5 flush ($26.64), and RSI and MACD have turned up with it. This is a recovery in momentum, not a classic divergence.
- CMF is still deeply negative (-0.196) while MACD and RSI recover. That is a mild bearish divergence in money flow: price is stabilizing but buyers are not committing.
- The MACD bullish crossover sits below the zero line, so it is a lower-conviction signal.
- ADX has fallen from 31 to 19.9 and the DIs have merged. The bearish trend impulse has exhausted and the market is shifting into consolidation.
- Price is above VWAP ($28.68) and EMA 13, but below EMA 34, SMA 50 ($37.44) and SMA 200 ($32.61). The long-term trend is still down, and the SMA 50 remains well below the SMA 200 in a death-cross configuration.
CHART PATTERNS
- Bearish Flag/Pennant (continuation): The sharp decline from about $33 to $26.6 is followed by tight sideways consolidation around $28-29. This is the main bearish risk. A break below about $28.00 would target a measured move toward $26-26.6.
- Bullish base/relief bounce (Bullish Falling Wedge-like): The Nov 5 flush at the lower Bollinger Band with a higher low afterward, plus the MACD cross and RSI recovery, supports a short-term bounce toward the EMA 34 near $29.60. The pattern is not a clean match.
- Over four days the bounce setup has slightly more evidence than the bearish flag, but resistance is close at $29.60 and rallies are likely to be capped there.
POTENTIAL SCENARIOS
- Scenario 1: Bullish Relief Bounce to EMA 34 — Price holds above the EMA 13/VWAP and the MACD recovery continues, pushing price into the EMA 34 area. Trigger: hourly close above $29.00 with RSI crossing 50. Target: $29.60, with a stretch to $30.10. Invalidation: close below $28.30. (45% probability)
- Scenario 2: Neutral Range Consolidation — With ADX under 20 and the DIs equal, price chops between $28.20 and $29.30 on light volume. Trigger: failure to break either $29.30 or $28.20. Target: $28.60-$28.90. Invalidation: decisive move beyond the range edges. (20% probability)
- Scenario 3: Bearish Flag Breakdown — Persistent negative CMF and the downtrend structure produce a rejection near $29.60 and a break lower. Trigger: hourly close below $28.00. Target: $26.60-$27.00 (the Nov 5 low zone). Invalidation: reclaim of $29.60. (35% probability)
PRICE TARGETS
- Target Price: $29.10 (4-day horizon)
- Expected Range: $28.00 to $29.60 (width $1.60, about 5.6% of current price, which fits a 4-day window)
- Key Levels: Support at $28.46 (EMA 13, with VWAP just below at $28.68 and the Bollinger midline near $28.41), Resistance at $29.60 (EMA 34)
OVERALL BIAS
OVERALL BIAS: BULLISH - The MACD bullish crossover, RSI recovery from oversold, and price holding above VWAP and EMA 13 favor a modest relief bounce toward the EMA 34 near $29.60. Conviction is limited by CMF distribution, the downtrend below the SMA 50 and SMA 200, and the bear-flag risk below $28.00.
This is educational analysis and not financial advice.