SMCI 6-day bullish forecast — Nov 8, 2026
- Bias: Bullish
- Timeframe: 6 days (made Nov 8, 2026, target date Nov 13, 2026)
- Price at analysis: $28.76
- Price target: $29.30
- Expected range: $27.80 – $30.00
- Result: Incorrect (-6.6%) — closed at $26.86 on Nov 13, 2026; quality score 0/100
Get a free AI analysis of SMCI today
Analysis
TECHNICAL INDICATORS
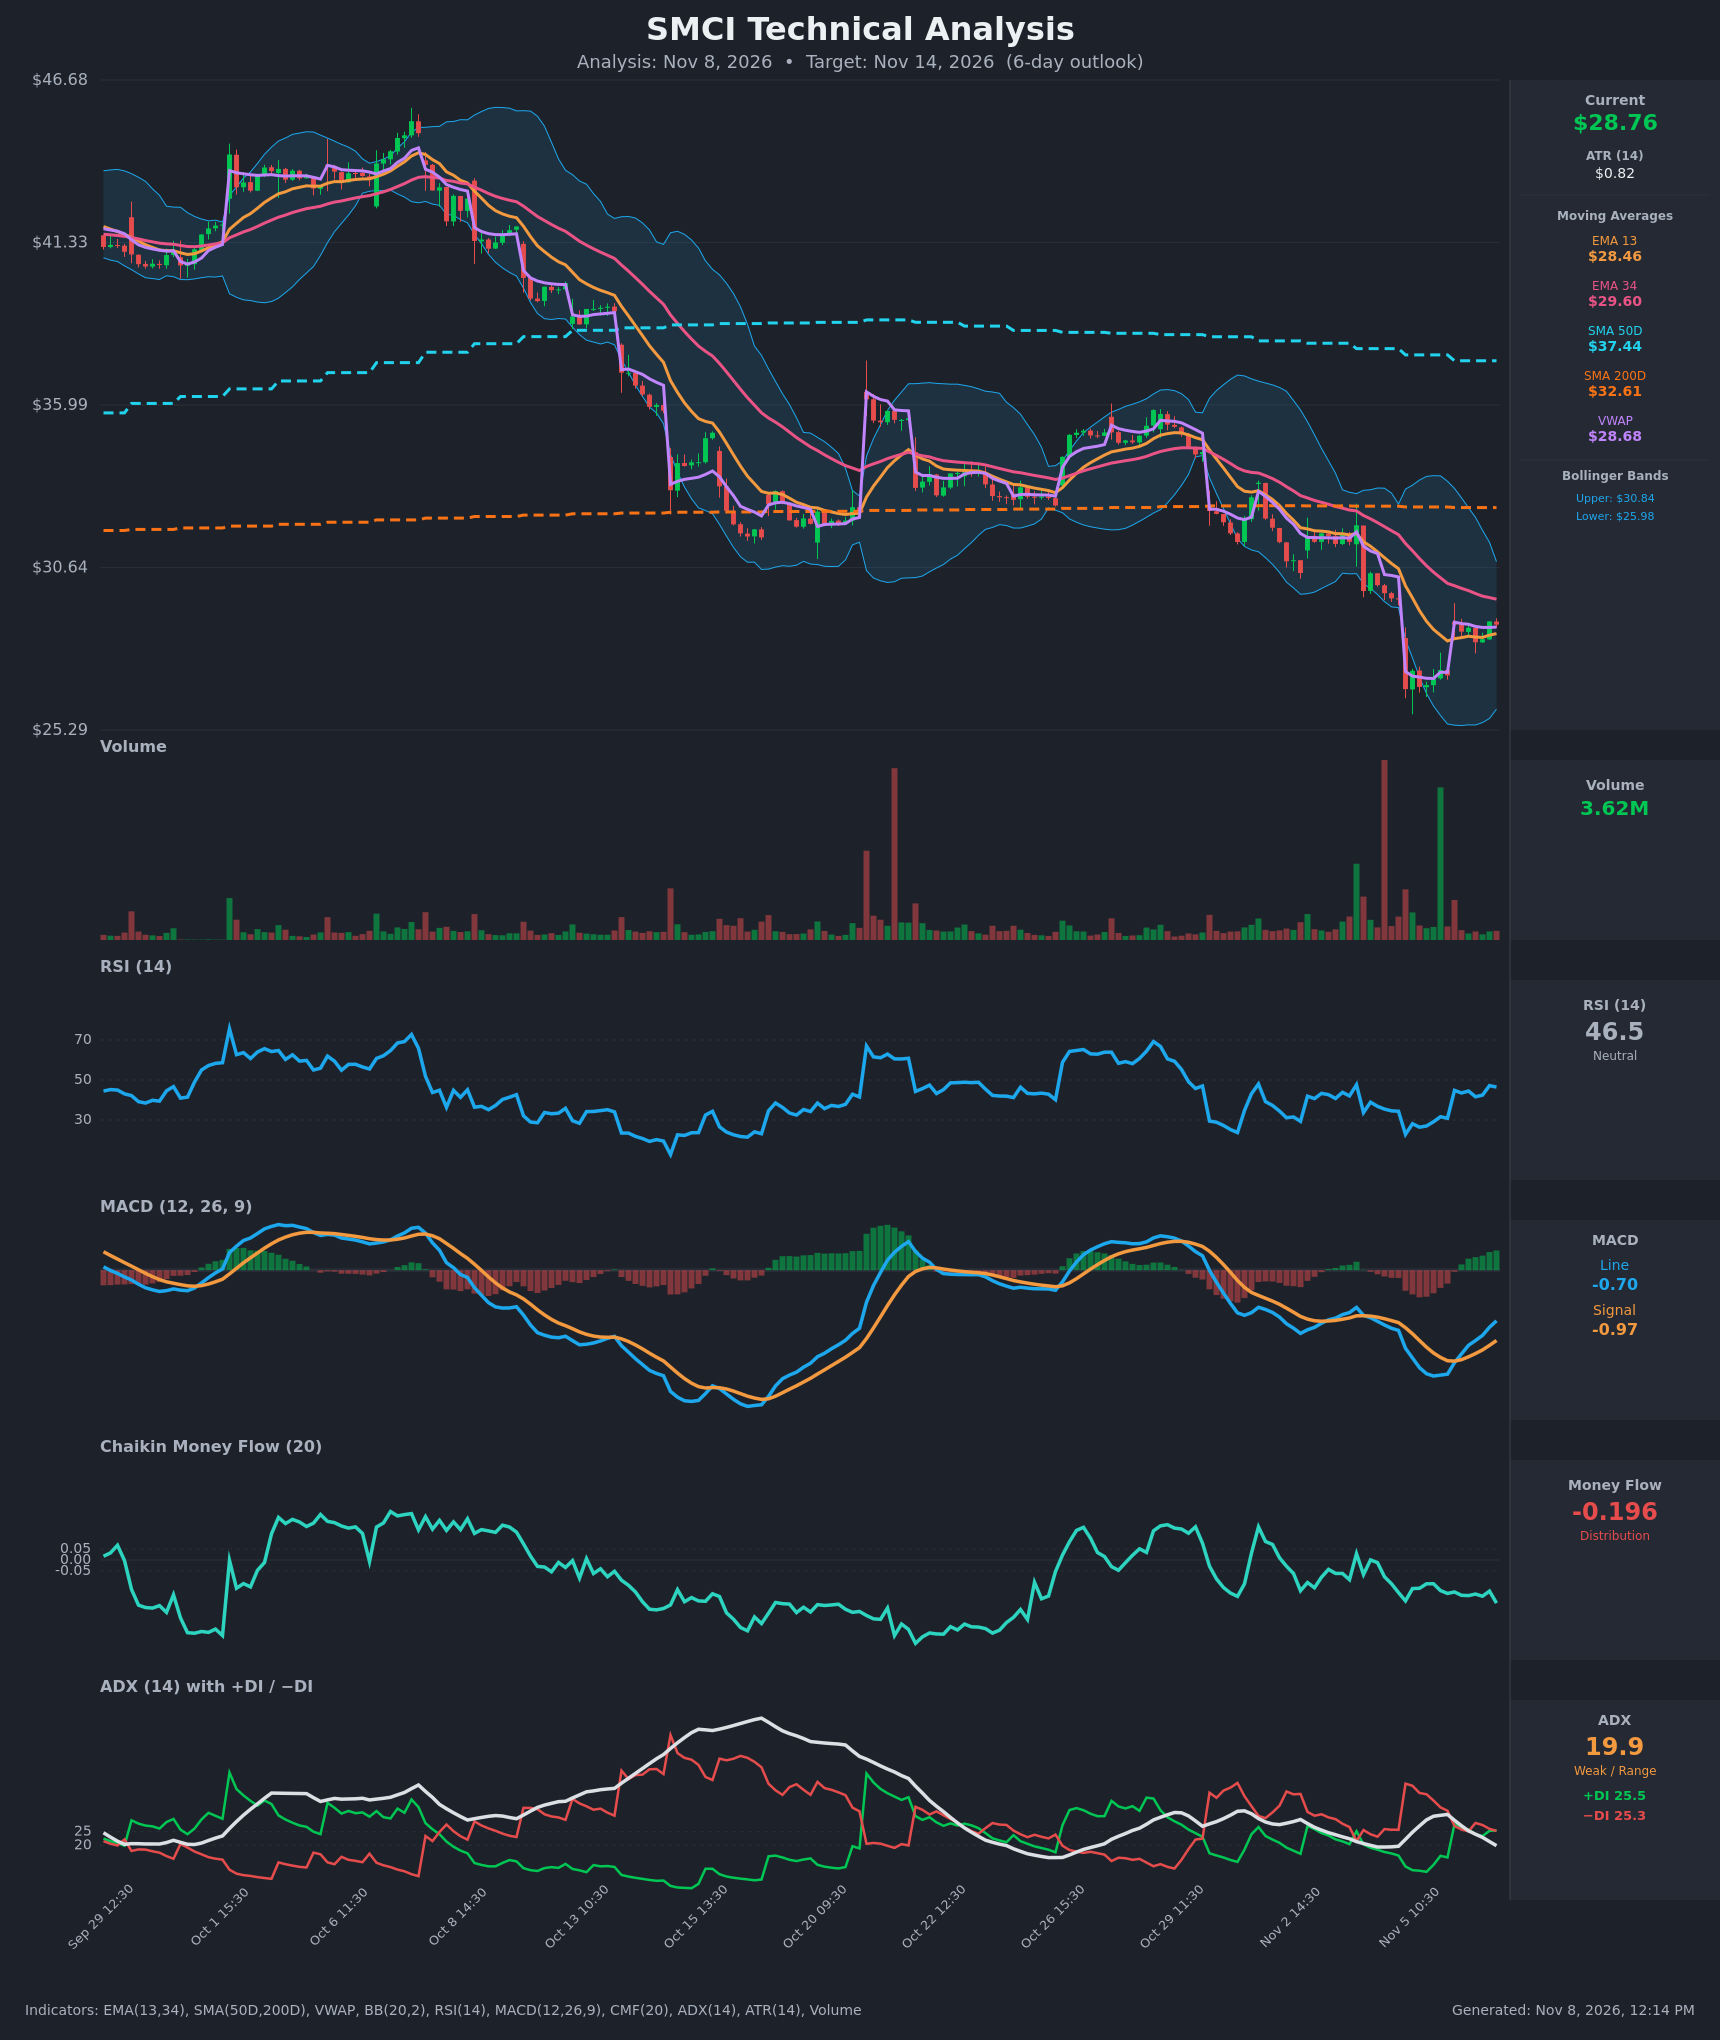
- RSI (14): 46.46, recovered from a deeply oversold 22.8 on Nov 5 and now back near the 50 midline. Momentum is improving but not yet above 50. [Neutral]
- 20 EMA: The chart shows EMA 13 ($28.46) and EMA 34 ($29.60). Price at $28.76 is above the EMA13, which is acting as short-term support. It is still below the EMA34, which is falling and sits about 2.9% overhead as resistance. EMA13 remains under EMA34, so there is no bullish crossover yet. [Neutral]
- MACD: Line -0.70 versus Signal -0.97. The line has been rising for about 8 bars and the histogram has turned positive (+0.27). A bullish crossover has just occurred or is imminent, but it is still below zero, so it is a recovery signal rather than a trend confirmation. [Bullish]
- Bollinger Bands (20): Upper $30.84, lower $25.98, with a midline near $28.4. Price recovered from the lower band tag and sits just above the midline, in the upper half of the lower range. The bands are wide after the selloff. The next band target is the upper band near $30.8. [Neutral]
- CMF (20): -0.196, well below -0.05 and in a sustained distribution regime with no sign of recovery. Rallies are not being backed by buying pressure. [Distribution]
- ADX (14): 19.9, down from 31 and below the 20 threshold, so the trend is weak or range-bound. +DI (25.5) and −DI (25.3) have converged to a virtual tie after −DI dominated at 42.6. The selling trend has exhausted but bulls have not taken control. [Weak Trend, Neutral]
- Volume: 3.62M. Large spikes accompanied the capitulation lows, including one green spike at the bounce. Volume has faded during the current consolidation near $28.50, so the stabilization lacks conviction. [Neutral, selling climax followed by a quiet base]
DIVERGENCES & TRENDS
- Price made a new low (~$26 on Nov 5) while RSI was deeply oversold. The RSI then recovered to the mid-40s as price held a higher low, which is an early sign of stabilization.
- MACD has curled up from its trough and is crossing its signal line. The histogram is flipping positive while price is still below the EMA34 and the 50/200 SMAs.
- CMF is making no higher lows and remains near -0.2. This is a bearish divergence against the MACD/RSI bounce and caps conviction.
- ADX has rolled over from 31 to 19.9 and the DIs have converged, which signals the downtrend is losing steam, not that it has reversed.
- Price is below the SMA200 ($32.61) and SMA50 ($37.44), so the long-term structure is bearish. The SMA50 is still above the SMA200, so no death cross has printed, but the gap is closing quickly.
- Price is above the VWAP ($28.68) and EMA13, a modest short-term positive.
CHART PATTERNS
- There is no clean textbook pattern. The structure is a capitulation low near $26, a gap-up bounce, and a tight sideways base around $28.2–$28.9.
- Reversal reading: the base resembles an early Bullish Double Bottom, with the Nov 5 lows and a higher retest, if $29.60 (EMA34) is cleared. The measured target is toward the $30.8 upper band.
- Continuation risk: the same consolidation could be a Bearish Pennant/Flag after the sharp drop. A break below ~$28.1 and then $27.0 would aim for $25.5–26.0.
- The decline since Oct 29 is a series of lower highs beneath a falling EMA34, so the primary trend remains down until $29.60 is reclaimed.
POTENTIAL SCENARIOS
- Scenario 1: Bullish Relief Rally to the EMA34 — MACD completes its bullish cross, price holds above the EMA13/VWAP, and RSI pushes above 50 as +DI takes the lead. Trigger: a close above $29.00 and then $29.60. Target: $29.60–$30.20, with an extension to the upper Bollinger Band near $30.80. Invalidation: close below $27.90. (45% probability)
- Scenario 2: Bearish Rejection and Lower Low — price stalls under the falling EMA34, CMF distribution persists, and the weak bounce rolls over like a bear flag. Trigger: rejection at $29.40–$29.60 or a break below $28.10. Target: $27.00, then $26.00 at the lower band. Invalidation: close above $29.70. (35% probability)
- Scenario 3: Neutral Range Consolidation — price chops between $27.80 and $29.50 with weak ADX and fading volume. Trigger: no breakout of either side. Target: $28.30–$29.00. Invalidation: close outside $27.50–$29.80. (20% probability)
PRICE TARGETS
- Target Price: $29.30 (6-day outlook)
- Expected Range: $27.80 to $30.00 (width $2.20, about 7.6% of current price, consistent with the 7–10 day guidance, scaled slightly down for 6 days)
- Key Levels: Support at $27.00, Resistance at $29.60
OVERALL BIAS
OVERALL BIAS: BULLISH - MACD is crossing up with a positive histogram, RSI has recovered from deeply oversold, price is above the EMA13 and VWAP, and the DIs have converged after the selling exhaustion. The upside is capped by the falling EMA34 near $29.60 and persistent CMF distribution, so conviction is modest.
This is educational analysis and not financial advice.