XLE 4-day bullish forecast — Nov 8, 2026
- Bias: Bullish
- Timeframe: 4 days (made Nov 8, 2026, target date Nov 11, 2026)
- Price at analysis: $61.64
- Price target: $62.20
- Expected range: $60.50 – $63.10
- Result: Correct (+2.8%) — closed at $63.37 on Nov 11, 2026; quality score 96/100
Get a free AI analysis of XLE today
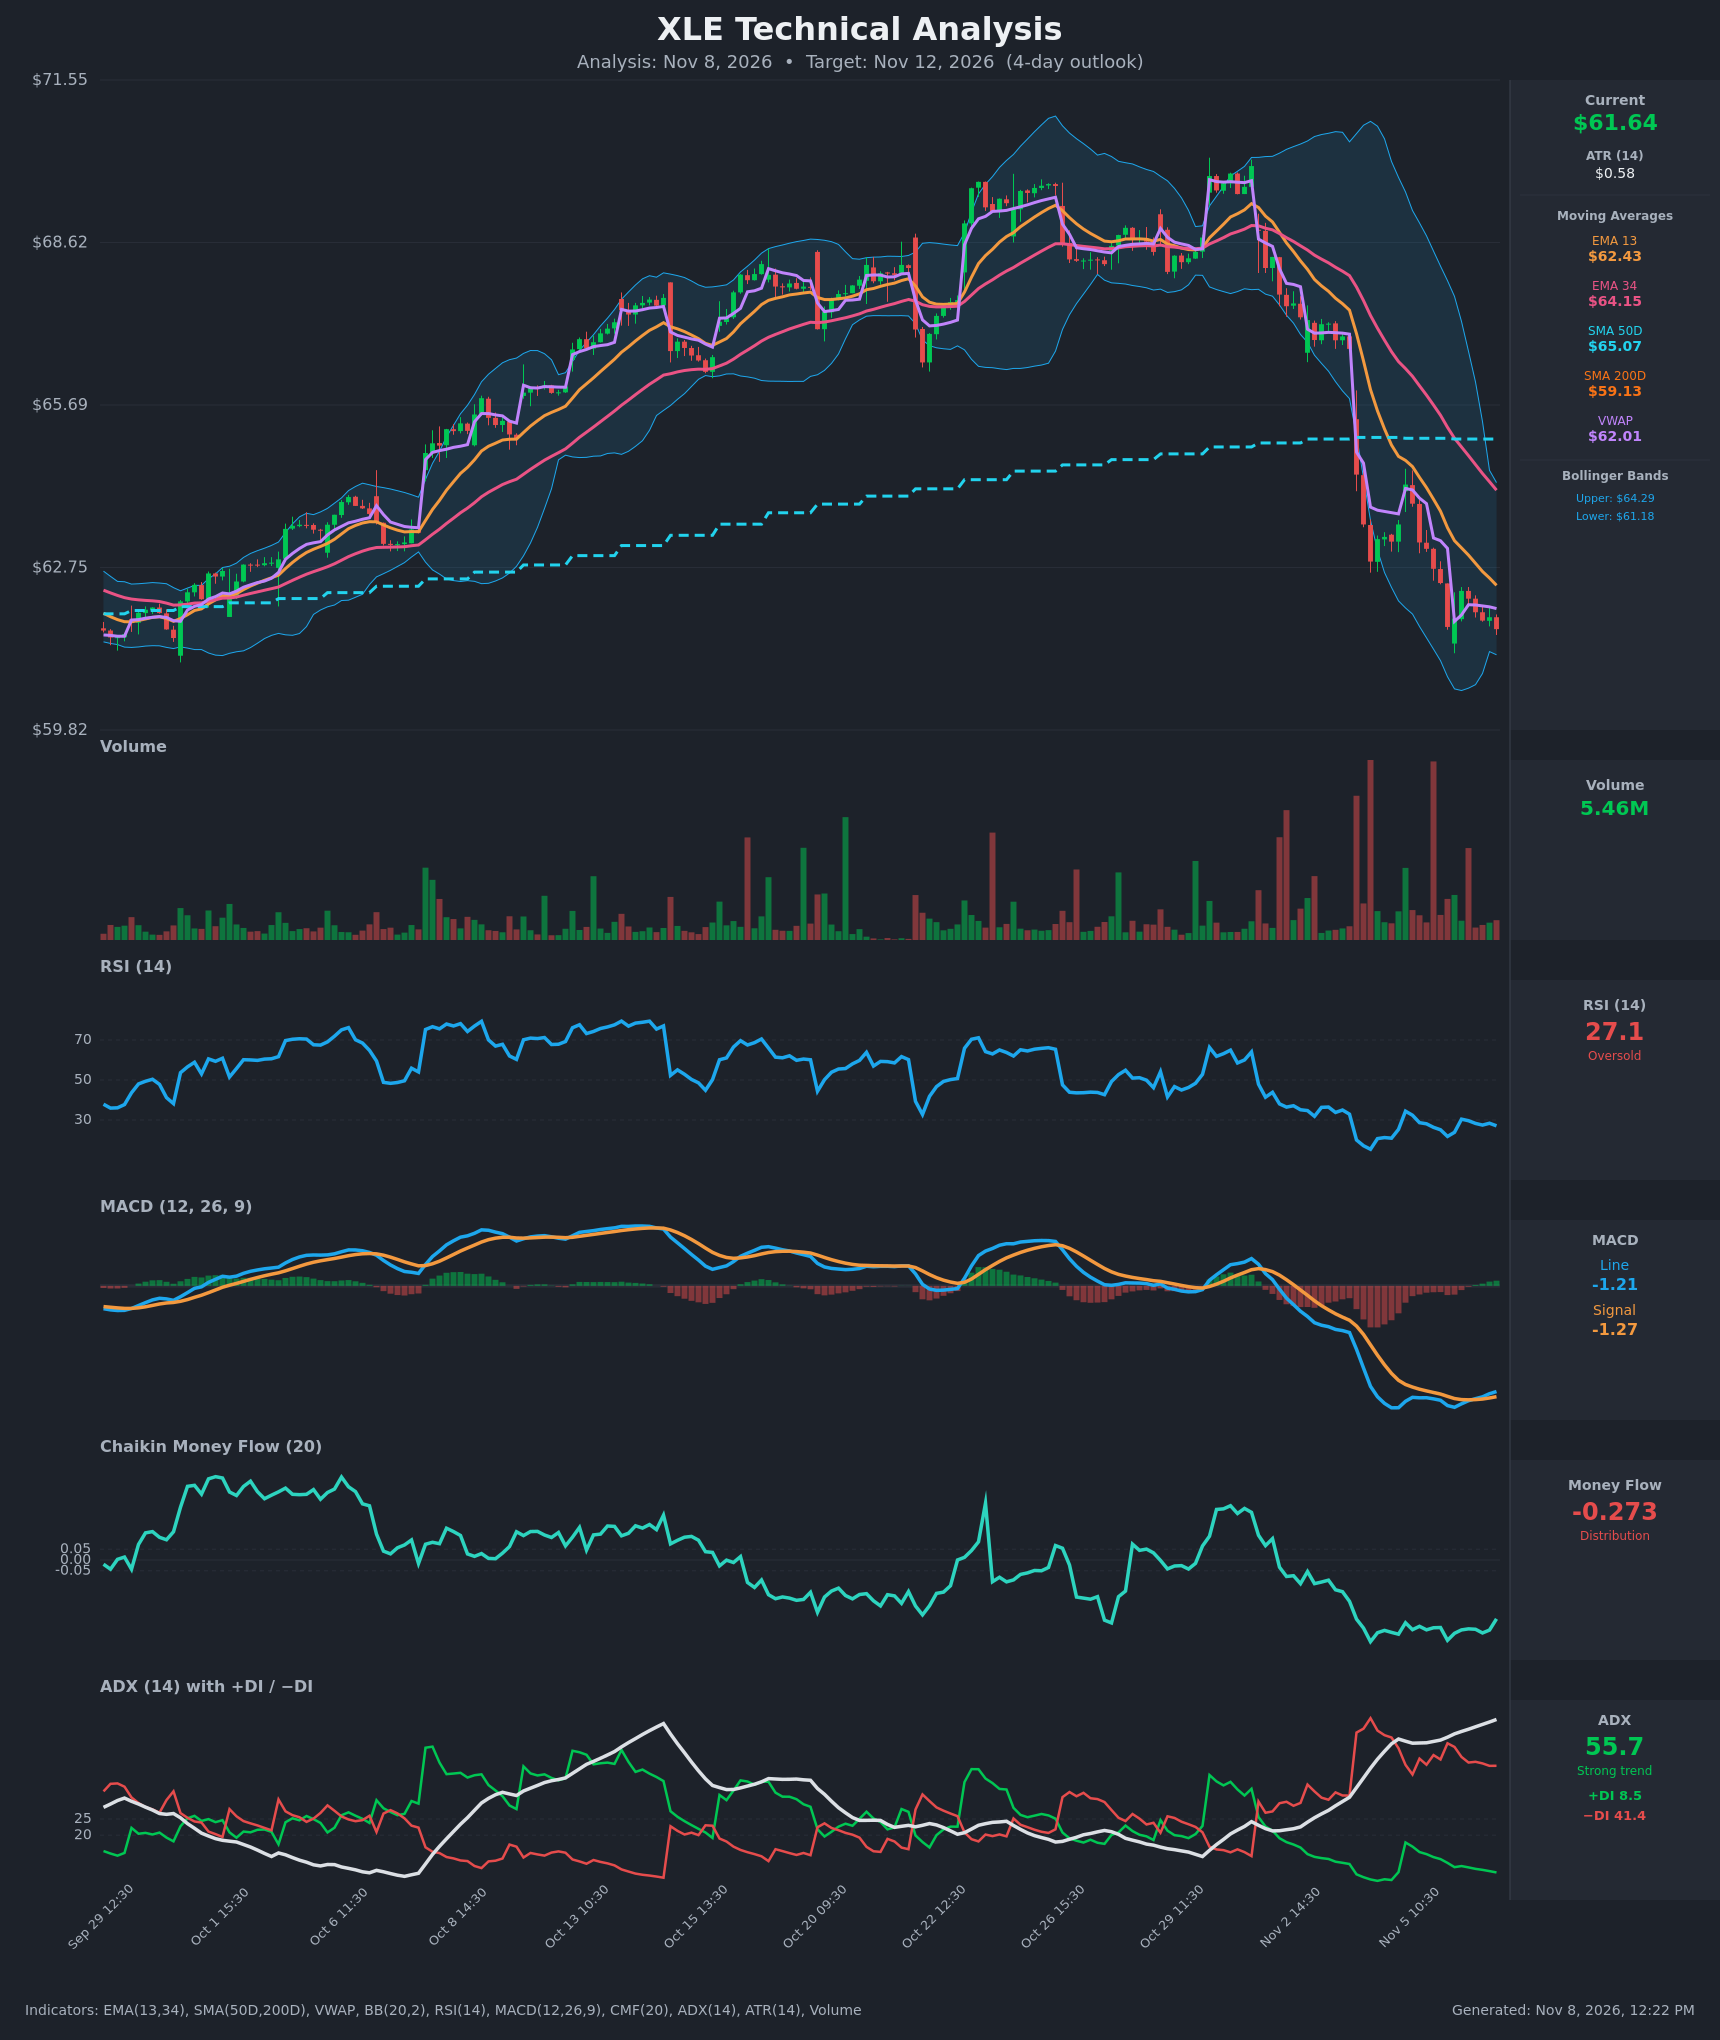
Analysis
TECHNICAL INDICATORS
- RSI (14): 27.08, oversold. It sits well above the 21.8 low from Nov 5 15:30 even though price is at the same level (about $61.64–$61.68), and it has been stuck in the 25–30 zone since. [Bullish]
- 20 EMA: Only EMA 13 ($62.43) and EMA 34 ($64.15) were supplied, so I use those. Price is below both, and EMA13 is below EMA34 with both falling. They act as overhead resistance. [Bearish]
- MACD: Line -1.214 is just above Signal -1.273, so the histogram has turned slightly positive. The line has been rising for several bars after bottoming, but it is still deeply negative and this is only a weak crossover. [Bullish]
- Bollinger Bands (20): Price is $61.64 against a lower band of $61.18 and an upper band of $64.29. It is in the bottom of the band after riding the lower band during the selloff. The bands are very wide, which signals high volatility and a stretched move. [Neutral]
- CMF (20): -0.273, strong distribution. It has been below -0.25 for days but ticked up from -0.338 to -0.273 in the last bars. Selling pressure is still dominant. [Distribution]
- ADX (14): 55.7 and still rising, a very strong trend. −DI (41.4) is far above +DI (8.5), so bears are in full control. Readings above 50 are often late-stage and can mark exhaustion. [Strong Trend – Bearish]
- Volume: 5.46M, back to ordinary levels after the heavy-volume capitulation bars on the drop (the large red spikes). The fading sell volume suggests selling pressure is easing. [Neutral / Selling Exhaustion]
DIVERGENCES & TRENDS
- Bullish divergence: On the hourly data, price made a marginally lower close ($61.64 vs $61.68) while RSI made a higher low (27.1 vs 21.8). MACD also made a higher low, a sign that downside momentum is fading.
- MACD: The line crossed above the signal, and the histogram has gone from deeply negative to slightly positive.
- Trend: The trend is still firmly down. Price is below EMA13, EMA34, SMA50D ($65.07) and VWAP ($62.01), and the lower highs continue. The SMA200D ($59.13) is the major long-term support about 4% below.
- ADX/DI: There is no DI crossover, and bears are still dominant. ADX above 55 is historically extreme, which raises the odds of a relief bounce but does not confirm a reversal.
- Moving averages: SMA50D is still above SMA200D, so there is no death cross. The earlier EMA13/EMA34 bearish crossover remains in force.
CHART PATTERNS
- Bearish Flag/Pennant (continuation): After a sharp drop from about $66 to about $61.7, price has consolidated in a narrow $61.6–$62.3 range with lower highs. Failure at VWAP or EMA13 would resume the decline, with a measured move toward $59–$60 near the SMA200D.
- Bullish Falling Wedge (reversal, tentative): The hourly decline into the lower band, with RSI and MACD higher lows, resembles a falling wedge or capitulation. A break above about $62.40 would confirm a bounce toward $63.0–$63.5.
- The pattern evidence is balanced. The divergences favor the reversal pattern, while the ADX and DI readings favor the continuation pattern.
POTENTIAL SCENARIOS
- Scenario 1: Bullish Oversold Relief Bounce — RSI divergence, the MACD cross and fading sell volume at the lower Bollinger Band allow a mean-reversion move toward VWAP and EMA13. Trigger: hourly close above $62.40 (EMA13) on rising volume. Target: $62.40–$63.10. Invalidation: close below $61.18 (lower band). (45% probability)
- Scenario 2: Bearish Trend Continuation — With −DI dominant, ADX rising and CMF at -0.27, the bear flag breaks lower and price tests the SMA200D area. Trigger: break of the $61.18–$61.30 support. Target: $60.20–$60.50, then $59.13. Invalidation: close above $62.45. (40% probability)
- Scenario 3: Neutral Sideways Basing — Price chops between $61.20 and $62.40 while indicators reset. Trigger: failure to break either side. Target: $61.50–$62.00. Invalidation: a decisive break of either boundary. (15% probability)
PRICE TARGETS
- Target Price: $62.20 (for the 4-day horizon, Nov 12, 2026)
- Expected Range: $60.50 to $63.10 (width $2.60, about 4.2% of the current price, consistent with a 4-day horizon of roughly 3–5%; this is about 4.5x ATR)
- Key Levels: Support at $61.18 (lower Bollinger Band), Resistance at $62.43 (EMA 13)
OVERALL BIAS
OVERALL BIAS: BULLISH - Price is oversold at the lower Bollinger Band, with a bullish RSI/MACD divergence, a MACD line crossing above its signal and fading sell volume. That favors a modest relief bounce toward $62.20. The bias carries modest conviction because the trend (ADX 55.7, −DI far above +DI, CMF -0.27) remains firmly bearish, and a break below $61.18 would flip the view.
This is educational analysis and not financial advice.