XLE 6-day bearish forecast — Nov 8, 2026
- Bias: Bearish
- Timeframe: 6 days (made Nov 8, 2026, target date Nov 13, 2026)
- Price at analysis: $61.64
- Price target: $60.90
- Expected range: $59.50 – $63.60
- Result: Incorrect (+5.4%) — closed at $64.96 on Nov 13, 2026; quality score 6/100
Get a free AI analysis of XLE today
Analysis
TECHNICAL INDICATORS
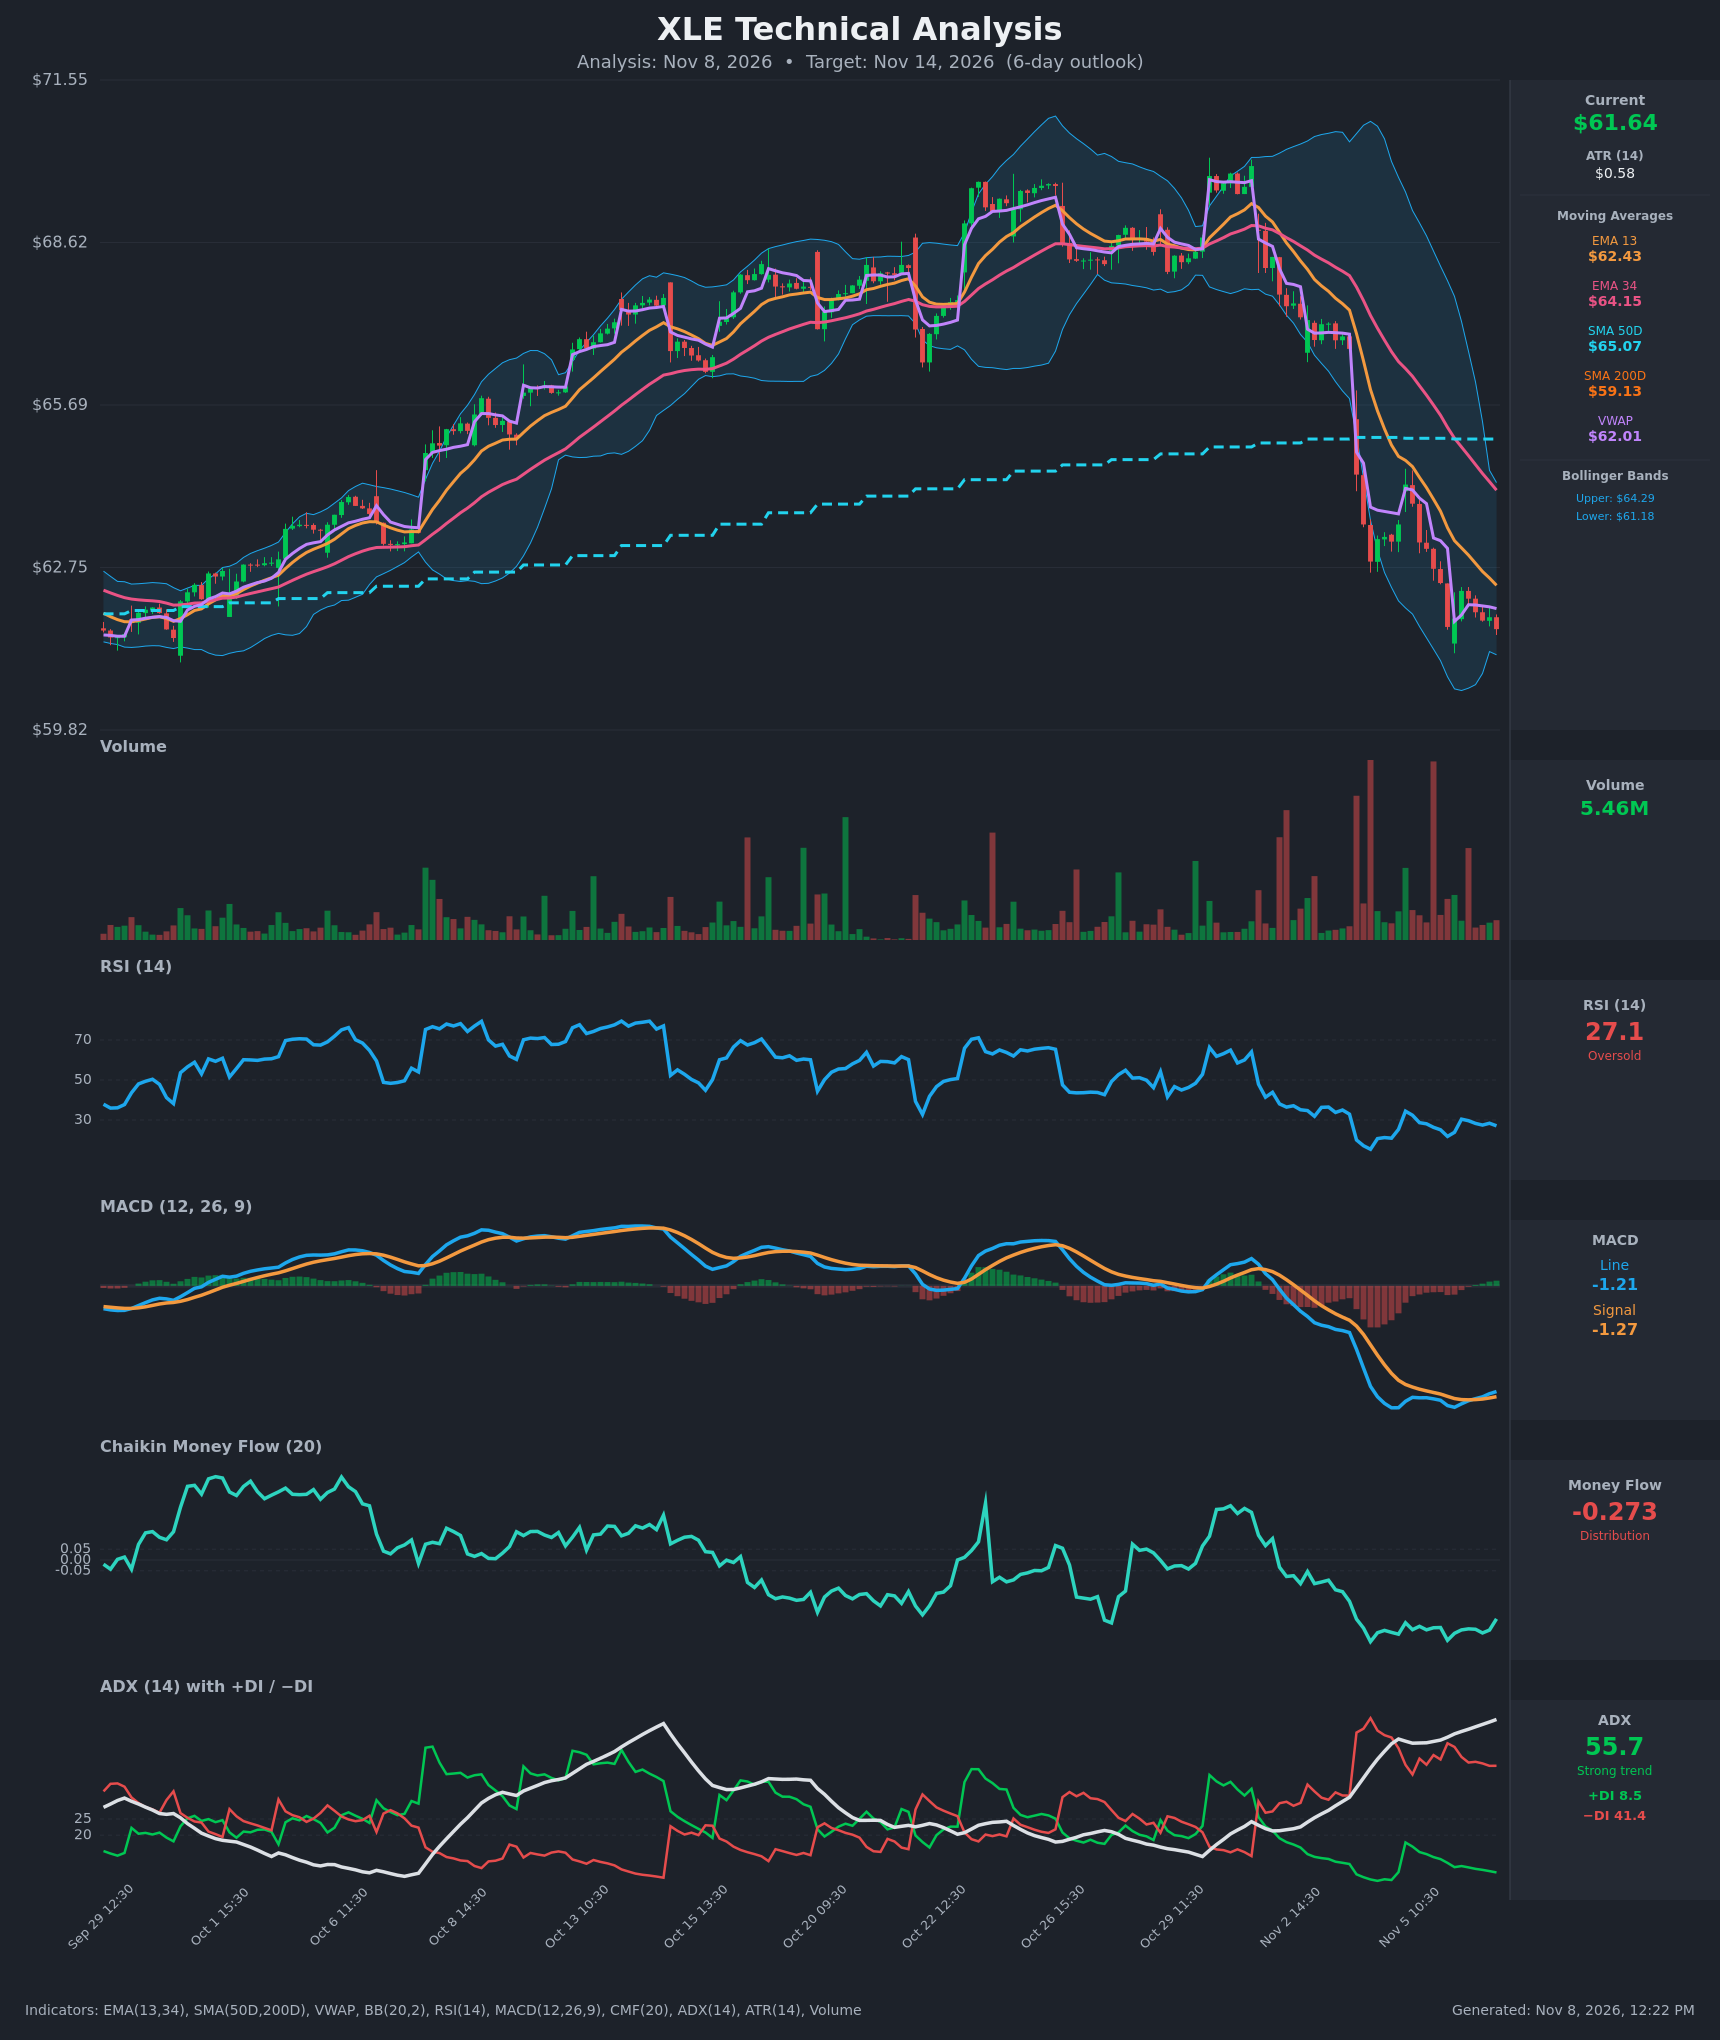
- RSI (14): 27.08, just above oversold. It has bounced from a low of 21.8 on Nov 5 15:30 and is holding in the 27-30 zone while price retests the same lows. Momentum is washed out but not yet turning up decisively. [Neutral]
- 20 EMA: The chart carries EMA 13 ($62.43) and EMA 34 ($64.15). Price at $61.64 is below both, and the EMAs are still falling. EMA 13 is below EMA 34, a bearish alignment, and EMA 13 is the first overhead resistance. [Bearish]
- MACD: Line -1.214 vs signal -1.273, so the histogram is slightly positive (+0.06). The line crossed above the signal around Nov 6 12:30. This is a small bullish crossover, but it sits deep below zero and reflects a slowing decline rather than a trend change. [Neutral]
- Bollinger Bands (20): Upper $64.29, lower $61.18. Price at $61.64 sits in the lower part of the band and is hugging the lower band after walking it down. The bands are very wide after the selloff, so volatility is elevated. This favors a possible relief bounce but also shows trend pressure. [Bearish]
- CMF (20): -0.273, well below -0.05 and near the cycle low. Distribution has persisted since mid-October with no sign of accumulation. [Distribution]
- ADX (14): 55.7 and still rising, with −DI 41.4 far above +DI 8.5. This is a very strong, one-sided downtrend. Readings this extreme can also signal late-stage trend exhaustion. [Strong Trend – Bearish]
- Volume: 5.46M, moderate and below the large red spikes seen during the Nov 3-5 breakdown. Selling volume is fading slightly, which hints at some seller fatigue but no bullish reversal volume yet. [Neutral / Fading Selling]
DIVERGENCES & TRENDS
- Mild bullish RSI divergence: price is at roughly the same level as Nov 5 15:30 ($61.68 vs $61.64), but RSI is 27 vs 21.8. This suggests downside momentum is easing.
- MACD: the bullish crossover with a flattening line shows decline momentum slowing. Still, MACD is at -1.2, far below zero.
- Trend structure: price fell from about $69.5 to $61.6 in a few sessions and is below EMA 13, EMA 34, VWAP ($62.01) and SMA50D ($65.07).
- Long-term trend: price is still above SMA200D ($59.13), which is the major long-term support about 4% below. SMA50D is flattening and rolling over but has not death-crossed SMA200D.
- DI and CMF: −DI has dominated since Nov 2 and CMF is persistently negative. Both confirm bears are in control.
- EMA 13 / EMA 34: the bearish EMA cross has already occurred and the gap is widening.
CHART PATTERNS
- No complete reversal pattern from the reference diagram has formed. The best fit is a Bearish Flag / Pennant (continuation): a sharp impulse down from about $66.7 to $61.6 followed by a tight, slightly sideways consolidation between about $61.6 and $62.3. A downside break would target roughly $60-$59, which lines up with the SMA200D at $59.13.
- A Bullish Falling Wedge is possible if price grinds lower with a slowing slope, as suggested by the RSI divergence. It needs a break above about $62.4 (EMA 13) to confirm and is not yet valid.
- The base case is flag-style continuation with a possible relief bounce toward EMA 13 / VWAP first.
POTENTIAL SCENARIOS
- Scenario 1: Bearish Trend Continuation — The flag resolves lower, with weak bounces rejected at VWAP/EMA 13 and the oversold reading persisting in a strong trend. Trigger: hourly close below the lower Bollinger Band / $61.18 and below the recent low near $61.5. Target: $60.00-$60.90, with an extension toward SMA200D at $59.13. Invalidation: close above $62.45 (EMA 13) with MACD histogram expanding. (50% probability)
- Scenario 2: Bullish Oversold Relief Bounce — RSI divergence and the MACD cross trigger short covering and a mean-reversion bounce toward the falling averages. Trigger: hold above $61.18 and a break above $62.01-$62.45 (VWAP/EMA 13). Target: $62.45-$63.30. Invalidation: loss of $61.18 / new lows below $61.50. (38% probability)
- Scenario 3: Neutral Consolidation — Price chops between $61.2 and $62.4 as selling fades but buyers stay absent. Trigger: low-volume sideways hourly action. Target: $61.50-$62.20. Invalidation: a decisive break outside the range. (12% probability)
PRICE TARGETS
- Target Price: $60.90 (6 days)
- Expected Range: $59.50 to $63.60 (width $4.10 ≈ 6.7% of current price, consistent with a 6-day horizon; hourly ATR of $0.58 over ~40 bars supports this)
- Key Levels: Support at $60.00 (near the SMA200D zone at $59.13), Resistance at $62.43 (EMA 13; VWAP at $62.01 is the first hurdle)
OVERALL BIAS
OVERALL BIAS: BEARISH - A very strong, one-sided downtrend (ADX 55.7, −DI 41.4 vs +DI 8.5), persistent distribution (CMF -0.27) and price below all short-term averages outweigh the oversold RSI and minor MACD cross. A relief bounce toward $62.4 is likely to meet resistance, and the SMA200D near $59 is the more probable magnet.
This is educational analysis and not financial advice.