BAC 6-day bearish forecast — Nov 8, 2026
- Bias: Bearish
- Timeframe: 6 days (made Nov 8, 2026, target date Nov 13, 2026)
- Price at analysis: $49.41
- Price target: $48.85
- Expected range: $47.60 – $50.40
- Result: Incorrect (+3.3%) — closed at $51.02 on Nov 13, 2026; quality score 28/100
Get a free AI analysis of BAC today
Analysis
TECHNICAL INDICATORS
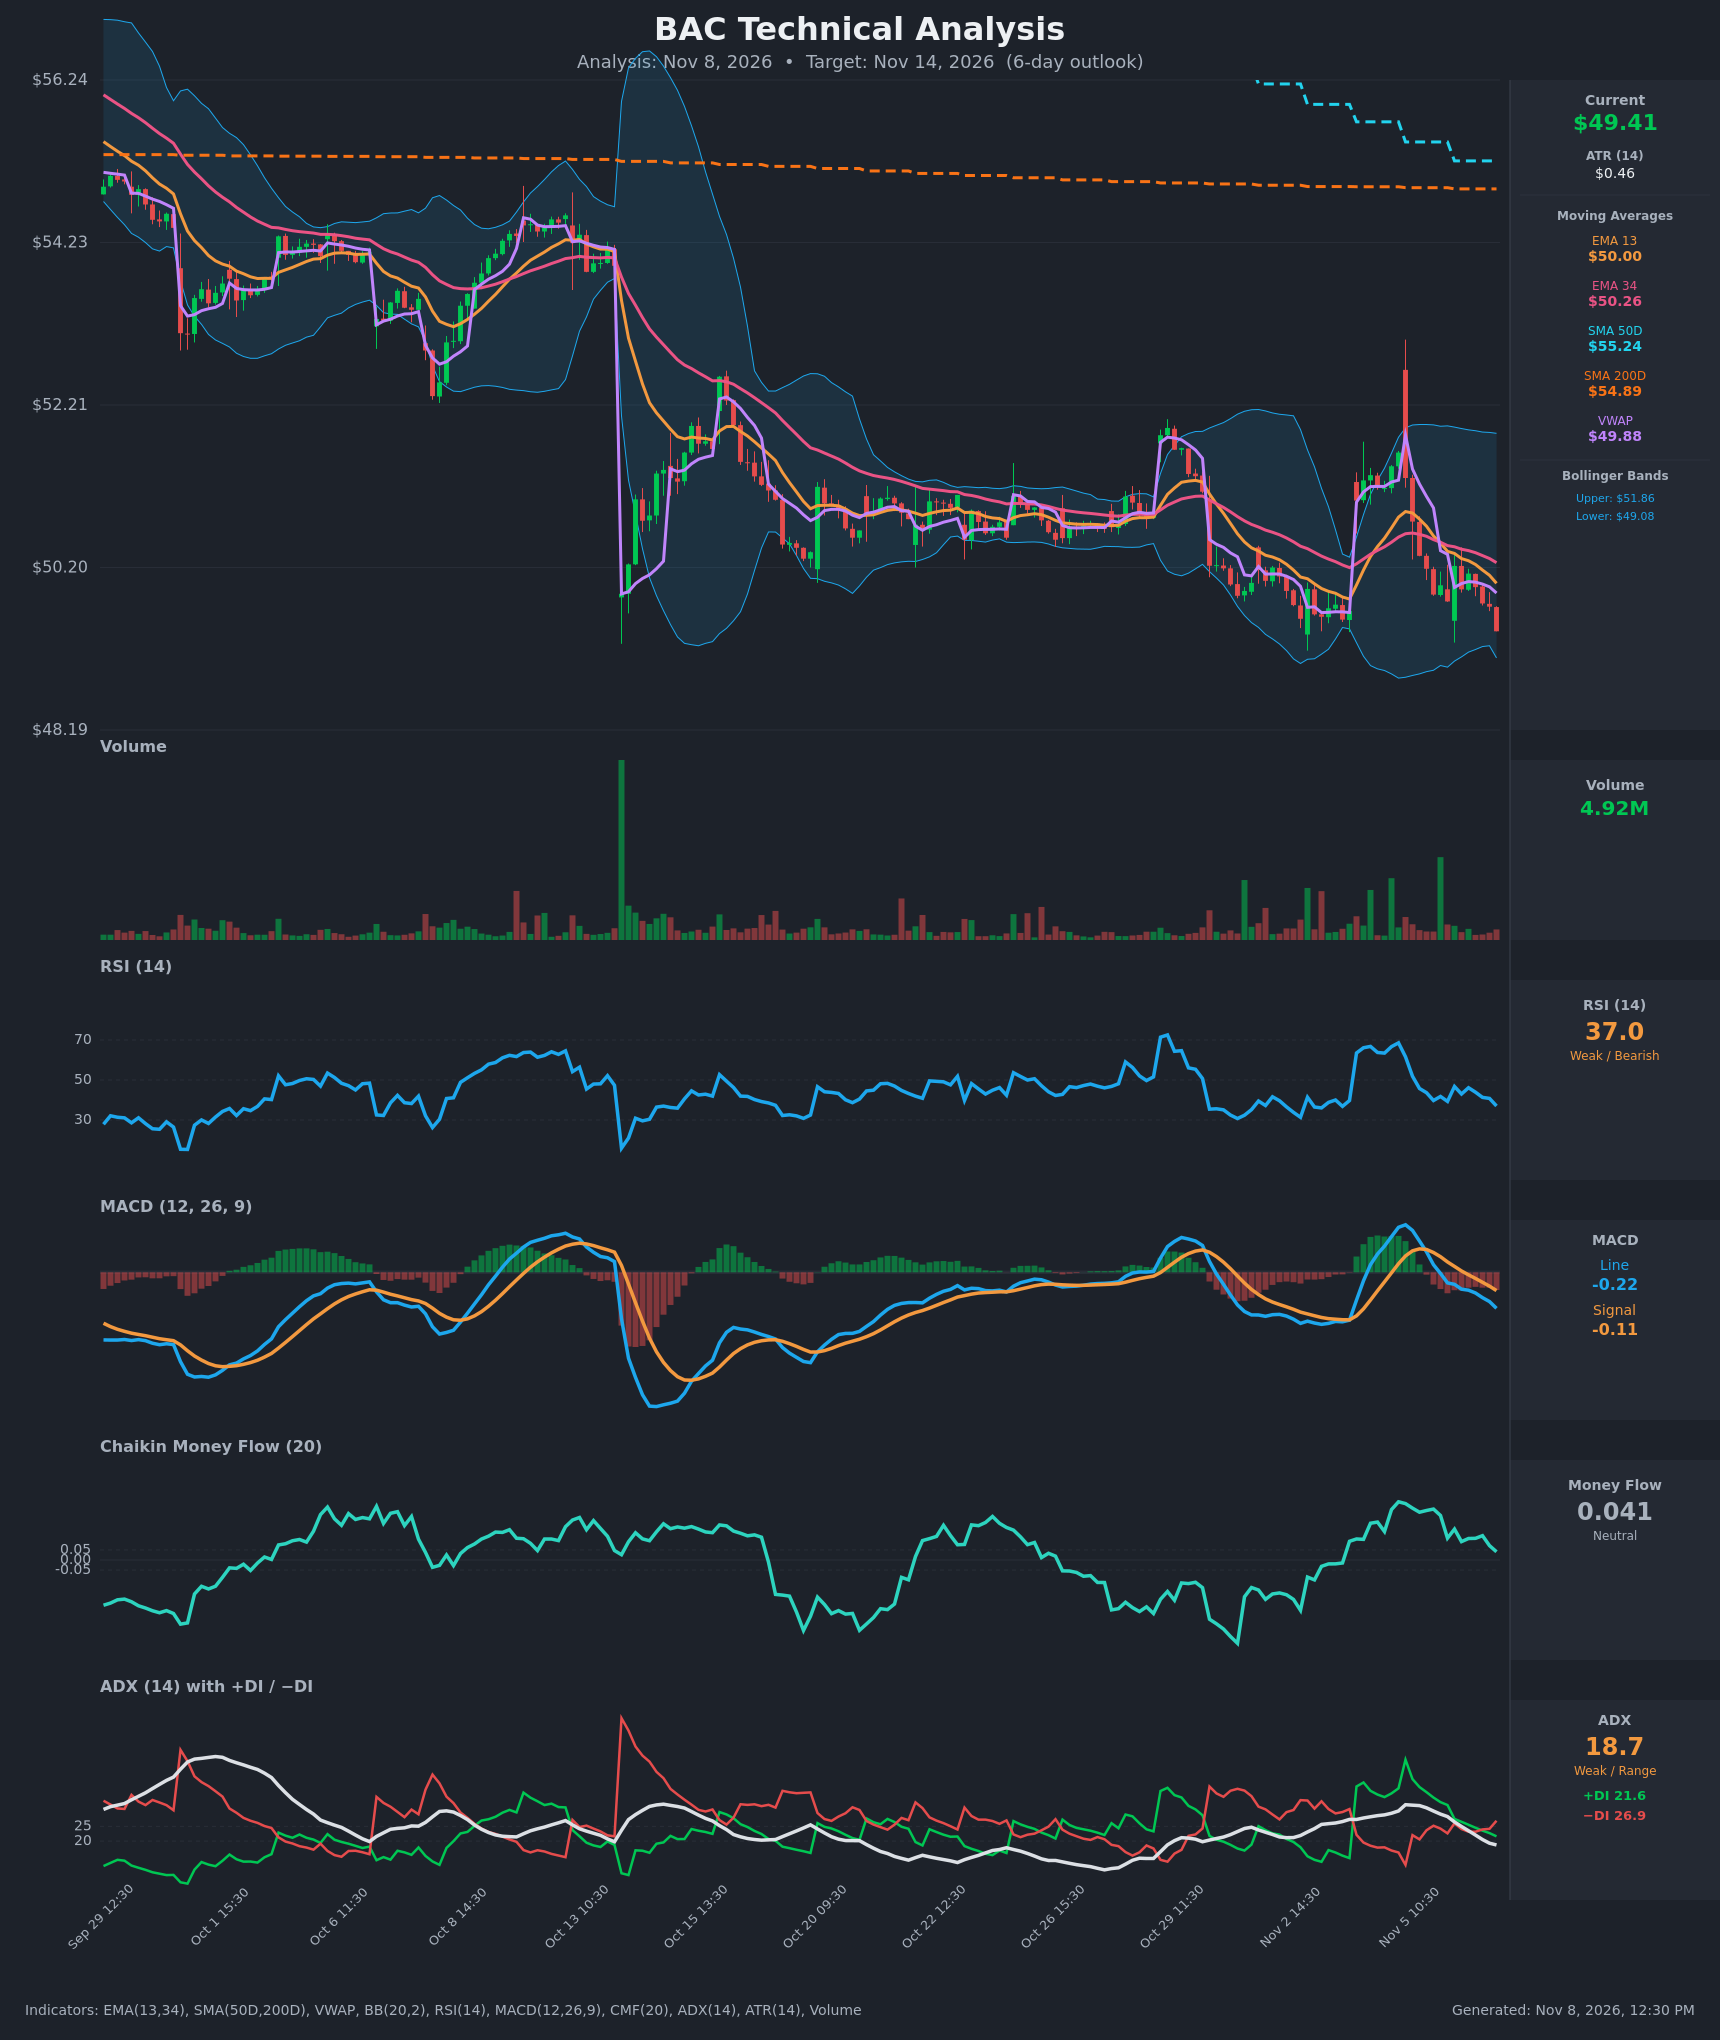
- RSI (14): 37.01, down from 68.6 on Nov 4 and in a steady downtrend. It is approaching oversold (30) but not there yet, so momentum is bearish with some room to fall. [Bearish]
- 20 EMA: The data provides EMA 13 at $50.00 and EMA 34 at $50.26. Price at $49.41 is below both, and EMA 13 crossed below EMA 34 around Nov 5. Both now act as overhead resistance. [Bearish]
- MACD: Line -0.216, signal -0.110, so the histogram is about -0.106 and widening. The line crossed below the signal on Nov 5 and then crossed below zero. Bearish momentum is accelerating. [Bearish]
- Bollinger Bands (20): Upper $51.86, lower $49.08. Price at $49.41 sits in the bottom ~12% of the band, near the lower band. The bands are wide after the Nov 4 spike. A band-walk lower is possible, but a mean-reversion bounce is also plausible. [Neutral]
- CMF (20): 0.041, between ±0.05. It has faded from +0.29 on Nov 4, so buying pressure has evaporated but there is no clear distribution yet. [Neutral]
- ADX (14): 18.7 and falling, so the trend is weak. −DI (26.9) is above +DI (21.6), and the bearish DI crossover occurred on Nov 6. Bears have a slight edge in a low-trend-strength environment. [Weak Trend, Bearish lean]
- Volume: 4.92M on the latest bar, modest and unremarkable. The Nov 4 spike bar was a large red-wick reversal on heavy volume, and the follow-through selling has been on moderate volume. There is no capitulation volume yet. [Neutral / mildly bearish]
DIVERGENCES & TRENDS
- No clear bullish divergence: RSI is making lower lows alongside price, and MACD is confirming the decline.
- Price is below VWAP ($49.88), EMA 13, EMA 34, SMA 50D ($55.24) and SMA 200D ($54.89). The long-term trend is down, with a 10%+ gap to the long-term averages. SMA 50D is still above SMA 200D, so there is no death cross yet, but the two are converging.
- Bearish crossovers have stacked up: EMA 13 below EMA 34, MACD below signal and zero, and −DI above +DI.
- The Nov 4–5 rally failed completely and was fully retraced. This is a bull trap that erased the gains.
- ADX is falling toward 18.7, so the move is losing trend strength. A bounce or chop is possible, but the bias remains down.
CHART PATTERNS
- The pattern is a lower-highs, lower-lows sequence after a failed breakout, resembling a Bearish Flag/Descending Triangle in a broader downtrend. Price is pressing against the $49.1–49.4 support zone (lower Bollinger Band) beneath declining resistance at EMA 13/34.
- A break below $49.08 would target roughly the pattern height of the recent range (about $1.0–1.5 lower), or about $48.00–48.50.
- This is not a textbook pattern. The earlier $50.00–51.00 sideways range resolved lower, which supports the continuation interpretation.
- The invalidation is a reclaim of $50.30 (EMA 34), which would turn this into a failed breakdown and a possible Double Bottom.
POTENTIAL SCENARIOS
- Scenario 1: Bearish Continuation Below Lower Band — Price breaks the lower Bollinger Band as MACD and −DI keep pressing down, and RSI drifts toward 30. Trigger: close below $49.08. Target: $48.20–$48.80. Invalidation: close above $50.30. (52% probability)
- Scenario 2: Bullish Oversold Bounce — Price holds the lower band and RSI stabilizes in the mid-30s, producing a reflex rally toward the EMAs and VWAP. Trigger: reclaim of $50.00 with rising volume. Target: $50.00–$50.60. Invalidation: close below $49.00. (30% probability)
- Scenario 3: Neutral Chop at Support — Price oscillates between $49.00 and $50.00 as ADX stays below 20. Trigger: no decisive break of either level. Target: $49.20–$49.80. Invalidation: close outside the $48.80–$50.30 zone. (18% probability)
PRICE TARGETS
- Target Price: $48.85 (6-day horizon)
- Expected Range: $47.60 to $50.40 (width $2.80, about 5.7% of the current price, consistent with the 4–8% guide for 6 days; roughly 2.5 ATR on each side)
- Key Levels: Support at $48.20, Resistance at $50.00
OVERALL BIAS
OVERALL BIAS: BEARISH - Price is below all key moving averages with a bearish MACD crossover, −DI above +DI and RSI trending down. The failed Nov 4–5 breakout argues for continuation toward $48.85. Weak ADX and a position near the lower Bollinger Band limit conviction, so a bounce toward $50 is the main risk.
This is educational analysis and not financial advice.