BAC 4-day bearish forecast — Nov 8, 2026
- Bias: Bearish
- Timeframe: 4 days (made Nov 8, 2026, target date Nov 11, 2026)
- Price at analysis: $49.41
- Price target: $49.00
- Expected range: $48.20 – $50.00
- Result: Incorrect (+2.6%) — closed at $50.67 on Nov 11, 2026; quality score 25/100
Get a free AI analysis of BAC today
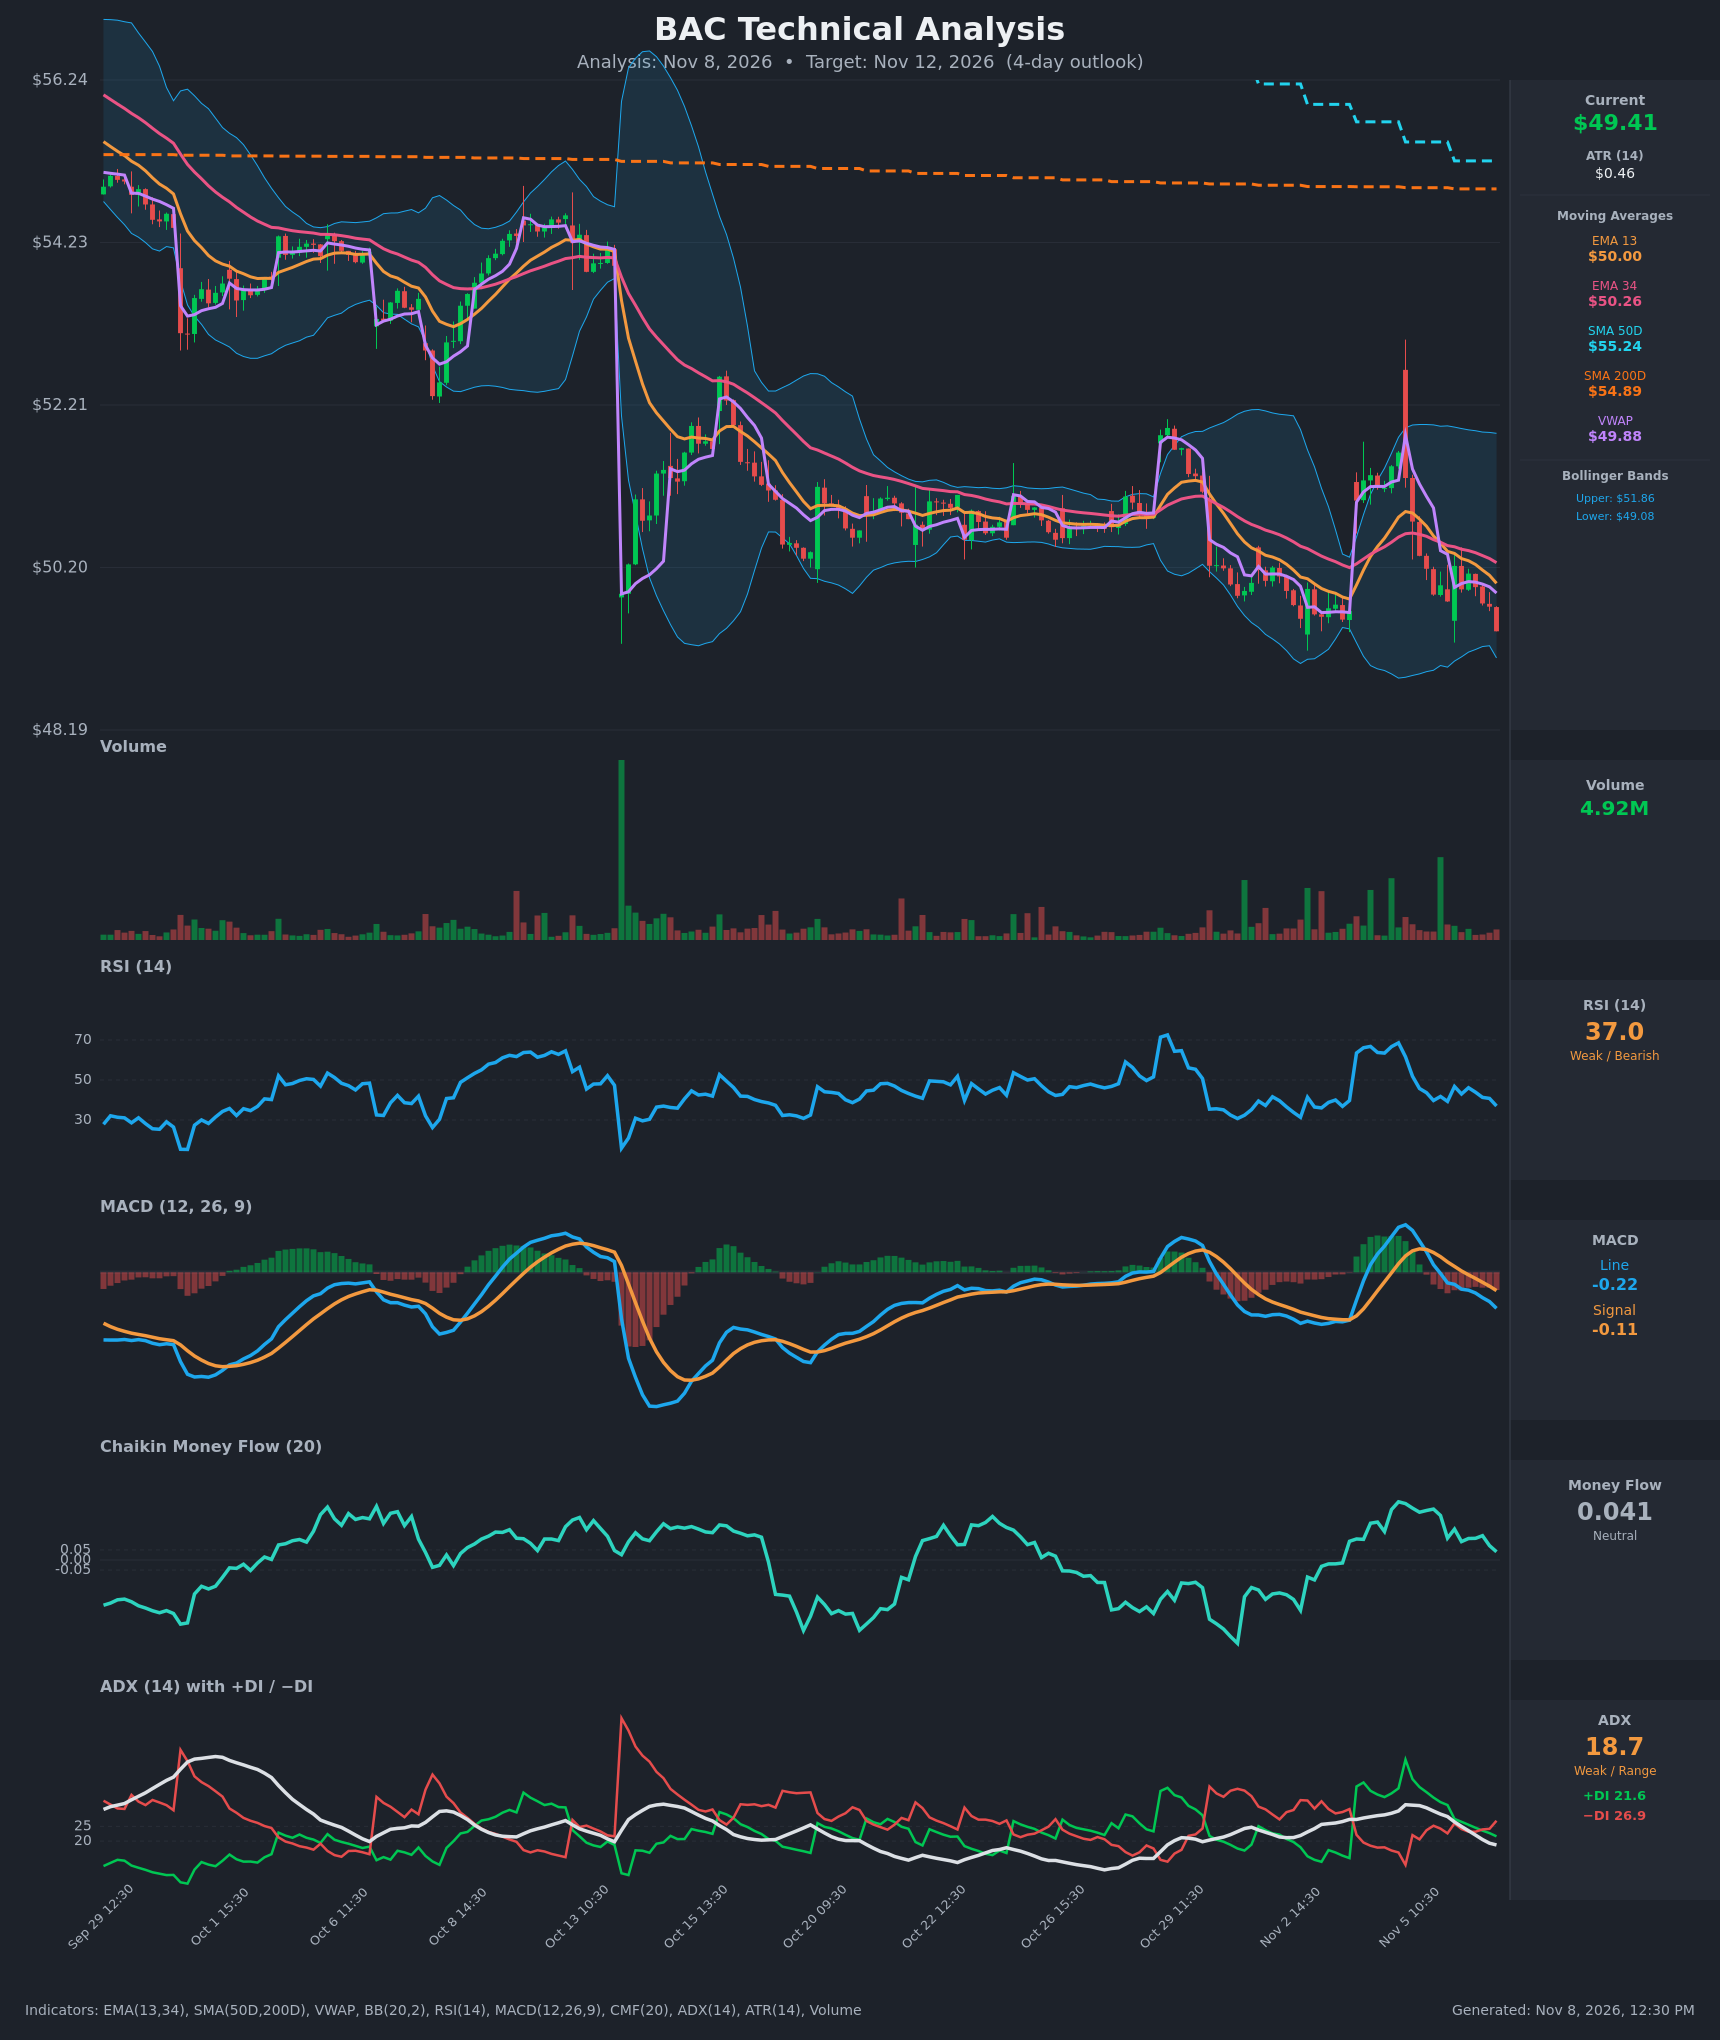
Analysis
TECHNICAL INDICATORS
- RSI (14): 37.01, down from 68.6 on Nov 4 and 46.7 on Nov 6 open. Momentum is falling and the reading is approaching oversold (30) without reaching it. [Bearish]
- 20 EMA: The data gives EMA 13 at $50.00 and EMA 34 at $50.26. Price at $49.41 is below both, and EMA13 crossed below EMA34 around Nov 5 14:30. Both averages are now overhead resistance. [Bearish]
- MACD: Line -0.216 is below signal -0.110, and the histogram is negative and widening. The line crossed below the signal on Nov 5 and has been falling since, so bearish momentum is accelerating. [Bearish]
- Bollinger Bands (20): Upper $51.86, lower $49.08. Price is hugging the lower band, about $0.33 above it, with the bands wide after the Nov 4-5 volatility spike. A walk down the lower band is possible, but so is a mean-reversion bounce toward the mid-band near $50.47. [Bearish]
- CMF (20): 0.041, between ±0.05, and fading from 0.289 on Nov 4. Accumulation has drained away but there is no clear distribution yet. [Neutral]
- ADX (14): 18.7 and falling, so the trend is weak. −DI (26.9) is above +DI (21.6), and the DIs crossed bearishly on Nov 6 around 13:30. Bears have the edge, but trend strength is low. [Weak Trend, Bearish lean]
- Volume: 4.92M, moderate. The Nov 4-5 spike came on heavier volume with a large reversal candle, and recent declines are on average volume, with no capitulation spike. Price is also below VWAP ($49.88). [Mildly Bearish]
DIVERGENCES & TRENDS
- There is no clear bullish divergence yet. RSI and MACD are making lower lows in line with price.
- The 15-bar table shows momentum rolling over. The MACD bearish cross, the EMA13/34 bearish cross and the −DI/+DI flip all happened within the last ~10 hourly bars.
- The sequence of lower highs since the Nov 4-5 spike ($52+) shows sellers capping every bounce at the EMAs and VWAP.
- Price is far below SMA50 ($55.24) and SMA200 ($54.89). Both are falling, and the long-term trend is down.
- ADX falling toward 18.7 means the selloff is not strongly trending. Mean-reversion bounces around the lower Bollinger Band are possible.
CHART PATTERNS
- There is no textbook pattern, but the structure resembles a Descending Triangle / Bearish Flag-style drift from the reference diagram. Lower highs press against horizontal support near $49.1–$49.4.
- A decisive break below roughly $49.08 (the lower BB) would target about $48.2–$48.5, the area of the chart's recent lows near $48.19, and the measured move is modest.
- The pattern is only tentative because ADX is weak. A failed breakdown would turn it into a range between roughly $49 and $50.
POTENTIAL SCENARIOS
- Scenario 1: Bearish Breakdown Continuation — Sellers keep rejecting at the EMAs and push price through the lower Bollinger Band, with the MACD histogram widening and −DI staying on top. Trigger: hourly close below $49.08. Target: $48.60–$49.00, with an extension to ~$48.20. Invalidation: close above $50.30 (above EMA13/EMA34). (50% probability)
- Scenario 2: Neutral Oversold Chop — Price holds the $49.0–$49.9 zone as RSI nears 30 and ADX stays below 20. Trigger: lower-band support holds and VWAP ($49.88) is recaptured only briefly. Target: $49.20–$49.80. Invalidation: a break below $48.90 or above $50.30. (28% probability)
- Scenario 3: Bullish Mean-Reversion Bounce — Oversold relief takes price back to the EMA cluster and mid-band. Trigger: hourly close above $50.00 with RSI turning up above 45. Target: $50.25–$50.50. Invalidation: rejection at $50.26 followed by a close below $49.30. (22% probability)
PRICE TARGETS
- Target Price: $49.00 (4-day horizon)
- Expected Range: $48.20 to $50.00 (width $1.80, about 3.6% of the current price, consistent with a 4-day timeframe and about 4 ATR)
- Key Levels: Support at $49.08, Resistance at $50.00
OVERALL BIAS
OVERALL BIAS: BEARISH - Price is below EMA13/EMA34 and VWAP, MACD is in a widening bearish cross, −DI is above +DI, RSI is falling, and the longer-term trend is down below SMA50/200. Conviction is modest because ADX is weak and price sits near the lower Bollinger Band, which leaves room for a relief bounce.
This is educational analysis and not financial advice.