TLT 6-day bullish forecast — Nov 8, 2026
- Bias: Bullish
- Timeframe: 6 days (made Nov 8, 2026, target date Nov 13, 2026)
- Price at analysis: $81.92
- Price target: $82.50
- Expected range: $80.25 – $83.60
- Result: Incorrect (-3.1%) — closed at $79.42 on Nov 13, 2026; quality score 34/100
Get a free AI analysis of TLT today
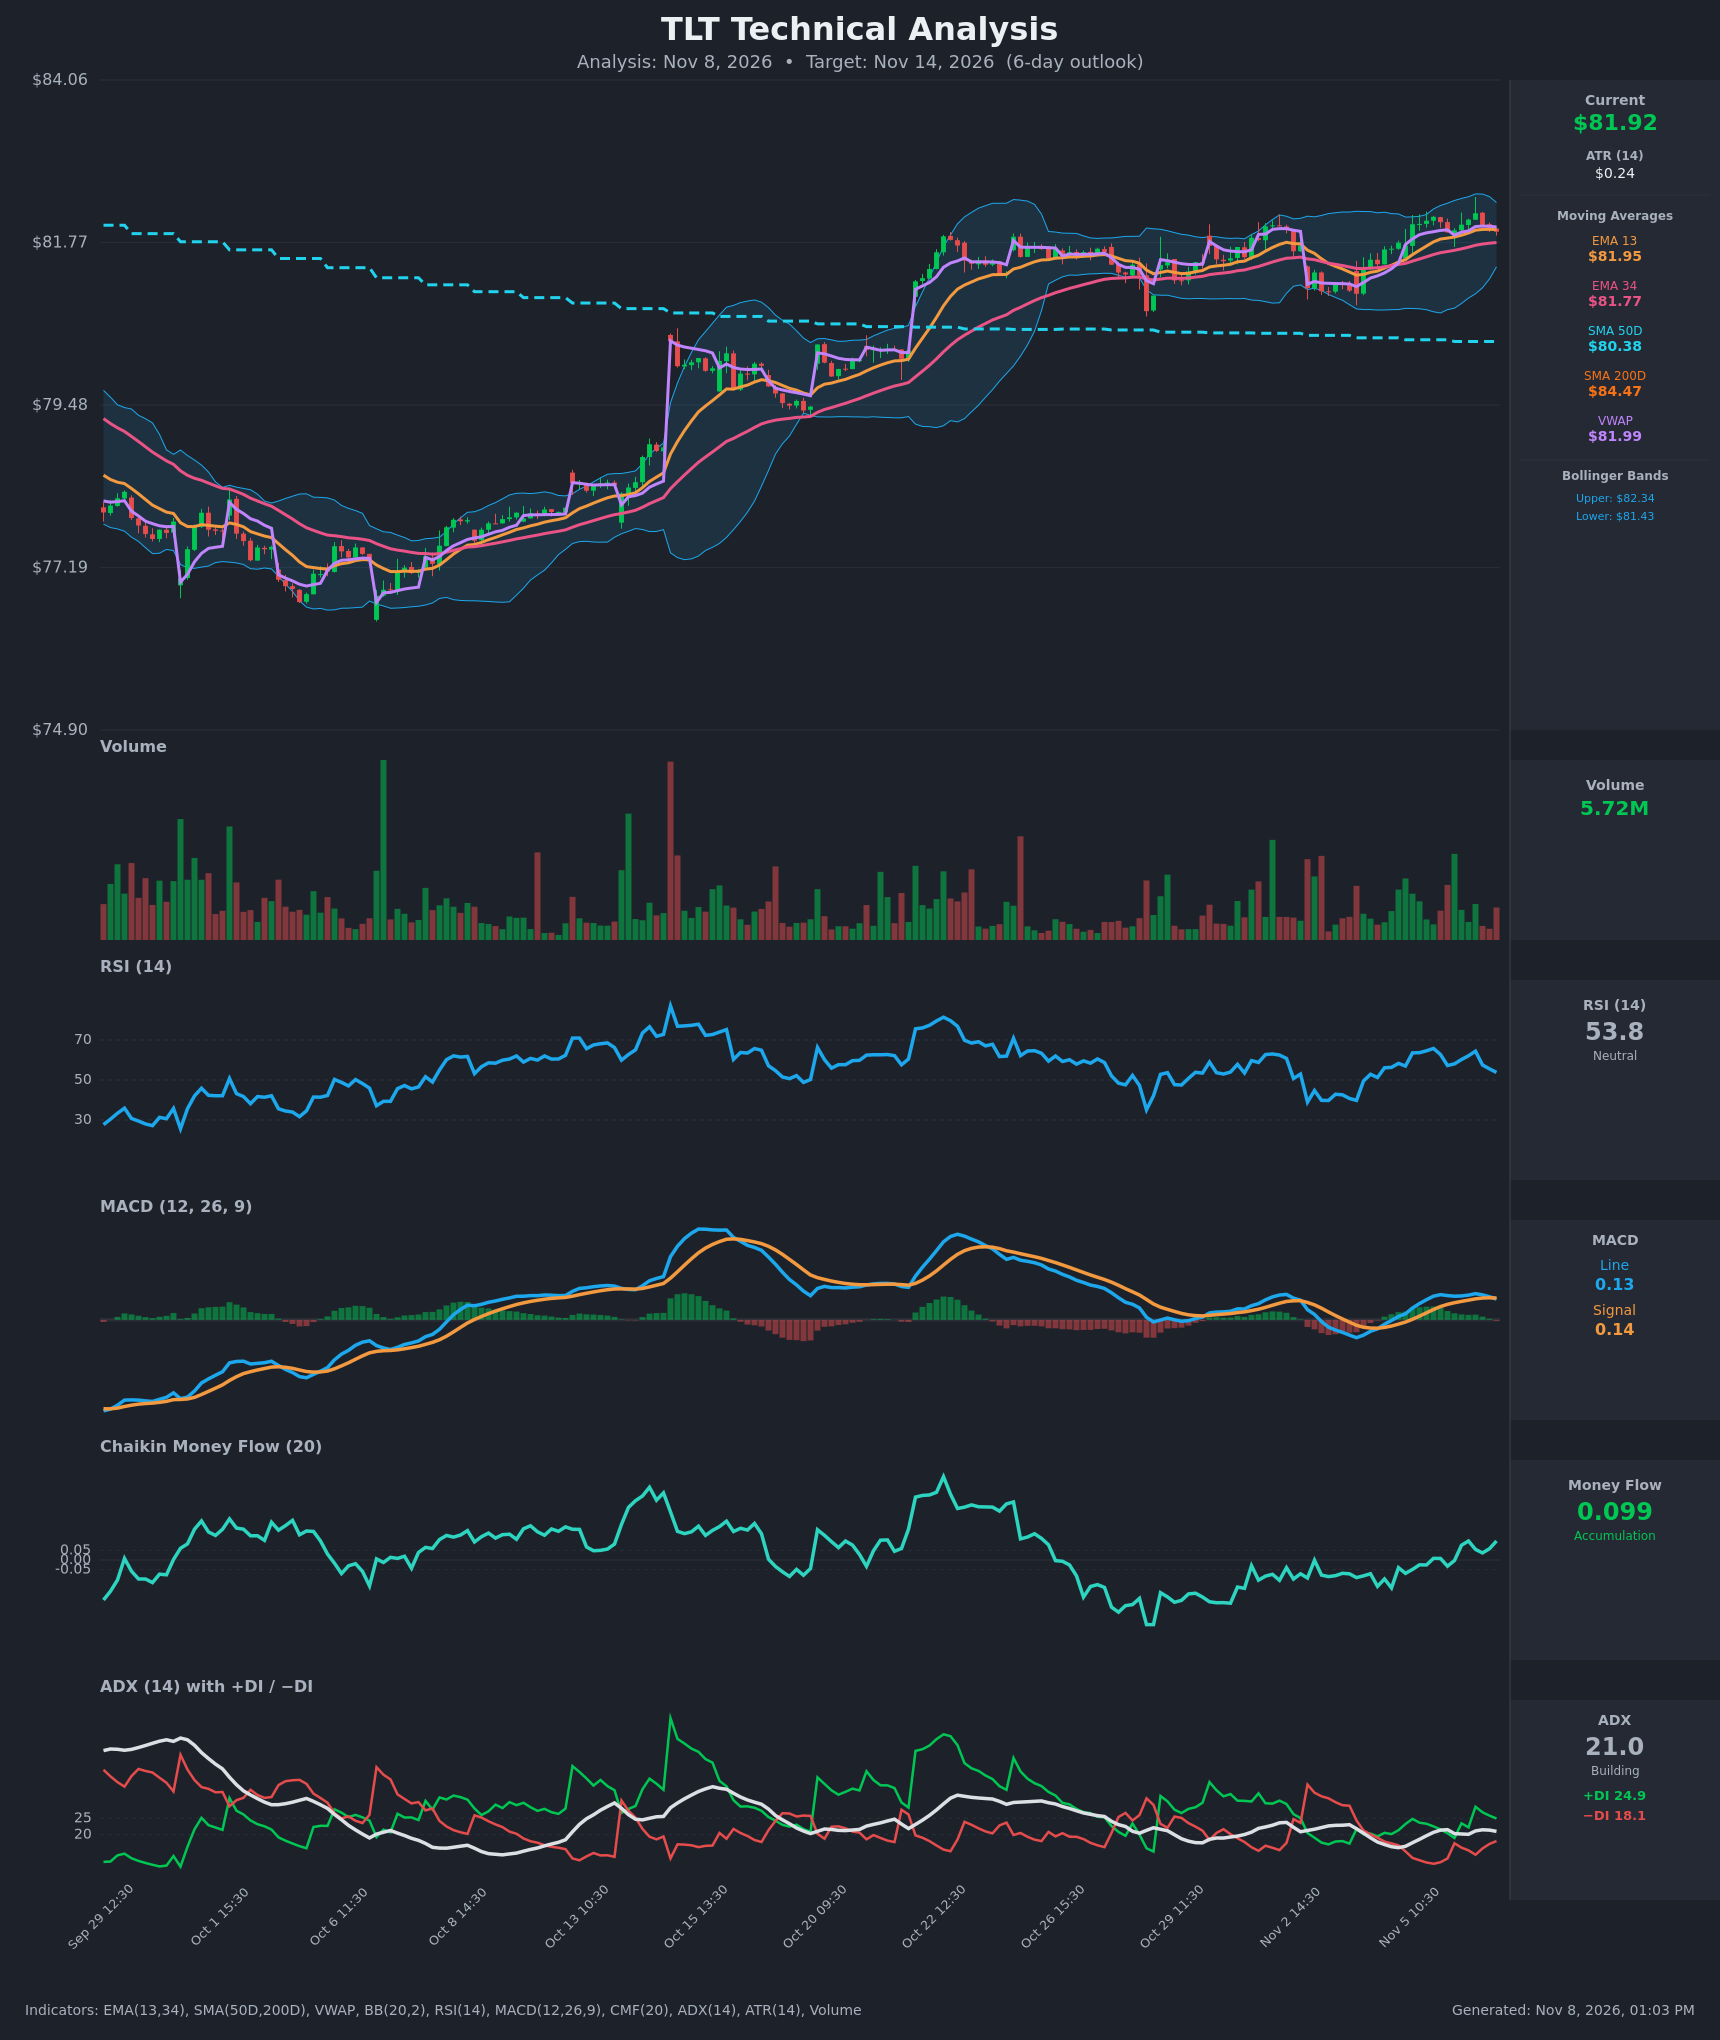
Analysis
TECHNICAL INDICATORS
- RSI (14): 53.8, down from the mid-60s earlier this week (65.8 on Nov 5). Momentum has cooled back to neutral without breaking below 50. [Neutral]
- 20 EMA (13/34 on this chart): EMA 13 is $81.95 and EMA 34 is $81.77. Price at $81.925 sits just under the EMA 13 and above the EMA 34. EMA 13 has been above EMA 34 since early Nov, so the short-term trend is up, but price is now testing the fast average. [Bullish]
- MACD: The line (0.131) just crossed below the signal (0.138), and the histogram is slightly negative. The line is still positive and well above the early-Nov trough, so this looks like a minor momentum pause rather than a trend reversal. [Bearish]
- Bollinger Bands (20): Upper $82.34, lower $81.43, midline about $81.88. Price is just above the midline after being rejected near the upper band (~$82.19 high on Nov 6). The bands are fairly narrow and have been widening off a squeeze, which fits a consolidation. [Neutral]
- CMF (20): 0.099, above the +0.05 threshold and rising from negative readings in early Nov. Buying pressure is building despite the pullback in price. [Accumulation]
- ADX (14): 21.0 with +DI 24.9 over −DI 18.1. The trend is only just emerging (the ADX rose from 16 to about 21), with bulls in control. The gap between the DIs has narrowed in the last few bars. [Weak/Emerging Trend – Bullish]
- Volume: 5.72M on the latest bar, about average with no spike. There is no climactic selling, and the recent advance came on steady buying volume. [Neutral to mildly supportive]
DIVERGENCES & TRENDS
- Bearish divergence (short term): Price is holding near its highs (~$81.9–82.2), but RSI has peaked lower (65.8 → 53.8) and the MACD line is flattening and has crossed below its signal. This is a minor loss of upside momentum.
- Bullish offset: CMF is rising and positive while the MACD cross is shallow. Money flow is not confirming a breakdown.
- Moving averages: Price is above the SMA50 ($80.38) and the EMA 34, so the intermediate trend is up. It is still below the SMA200 ($84.47), which is falling and acts as long-term overhead resistance. There is no golden cross, and the 50 and 200 are still well apart.
- VWAP: At $81.99, VWAP is marginally above price, so there is slight intraday seller pressure at the highs.
- Larger structure: Price has advanced from ~$77 to ~$82 with higher lows and a series of higher plateaus.
CHART PATTERNS
- Ascending Triangle / bullish consolidation (loose fit): After the Oct 22 gap higher, price has ranged between ~$80.7 and ~$82.4 with rising lows and flat resistance near $82.2–82.5. A close above ~$82.5 would project a measured move of about $1.5–1.8 toward ~$84, which is also where the SMA200 sits.
- Caveat: The pattern is not clean and ADX is only ~21. A rejection at resistance would turn this into a range-bound or double-top-like structure, with $81.4 as the neckline-type support.
POTENTIAL SCENARIOS
- Scenario 1: Bullish Breakout of Range High — Rising CMF, +DI dominance and the stack of higher lows support another push into resistance, and the MACD dip resets. Trigger: hourly close above $82.35 (upper band) and then $82.50 on rising volume. Target: $82.50–83.20. Invalidation: close below $81.40. (50% probability)
- Scenario 2: Neutral Range Chop — Price oscillates around the EMAs and the Bollinger midline, capped by $82.4 and supported by $81.4, as ADX stays near 20. Trigger: failed breakout attempts with flat MACD. Target: $81.50–82.30. Invalidation: close beyond $82.6 or below $81.3. (27% probability)
- Scenario 3: Bearish Rejection and Pullback — The bearish MACD cross extends, price is rejected at the band and VWAP, and it slips through EMA 34 toward the range floor. Trigger: close below $81.43 (lower band) with −DI crossing above +DI. Target: $80.70–80.40 (SMA50 area). Invalidation: reclaim of $82.00. (23% probability)
PRICE TARGETS
- Target Price: $82.50 (6-day horizon)
- Expected Range: $80.25 to $83.60. Width is $3.35, about 4.1% of the current price, which is appropriate for a 6-day window.
- Key Levels: Support at $81.43, Resistance at $82.50
OVERALL BIAS
OVERALL BIAS: BULLISH - Price holds above the EMA 34 and SMA50 with higher lows, +DI above −DI and CMF in accumulation (0.099), which outweigh the shallow MACD cross and cooling RSI. The pattern is a constructive consolidation under $82.5 resistance, though the conviction is modest and the SMA200 at $84.47 caps the larger upside.
This is educational analysis and not financial advice.