TLT 4-day bullish forecast — Nov 8, 2026
- Bias: Bullish
- Timeframe: 4 days (made Nov 8, 2026, target date Nov 11, 2026)
- Price at analysis: $81.92
- Price target: $82.25
- Expected range: $80.60 – $83.40
- Result: Incorrect (-1.3%) — closed at $80.90 on Nov 11, 2026; quality score 50/100
Get a free AI analysis of TLT today
Analysis
TECHNICAL INDICATORS
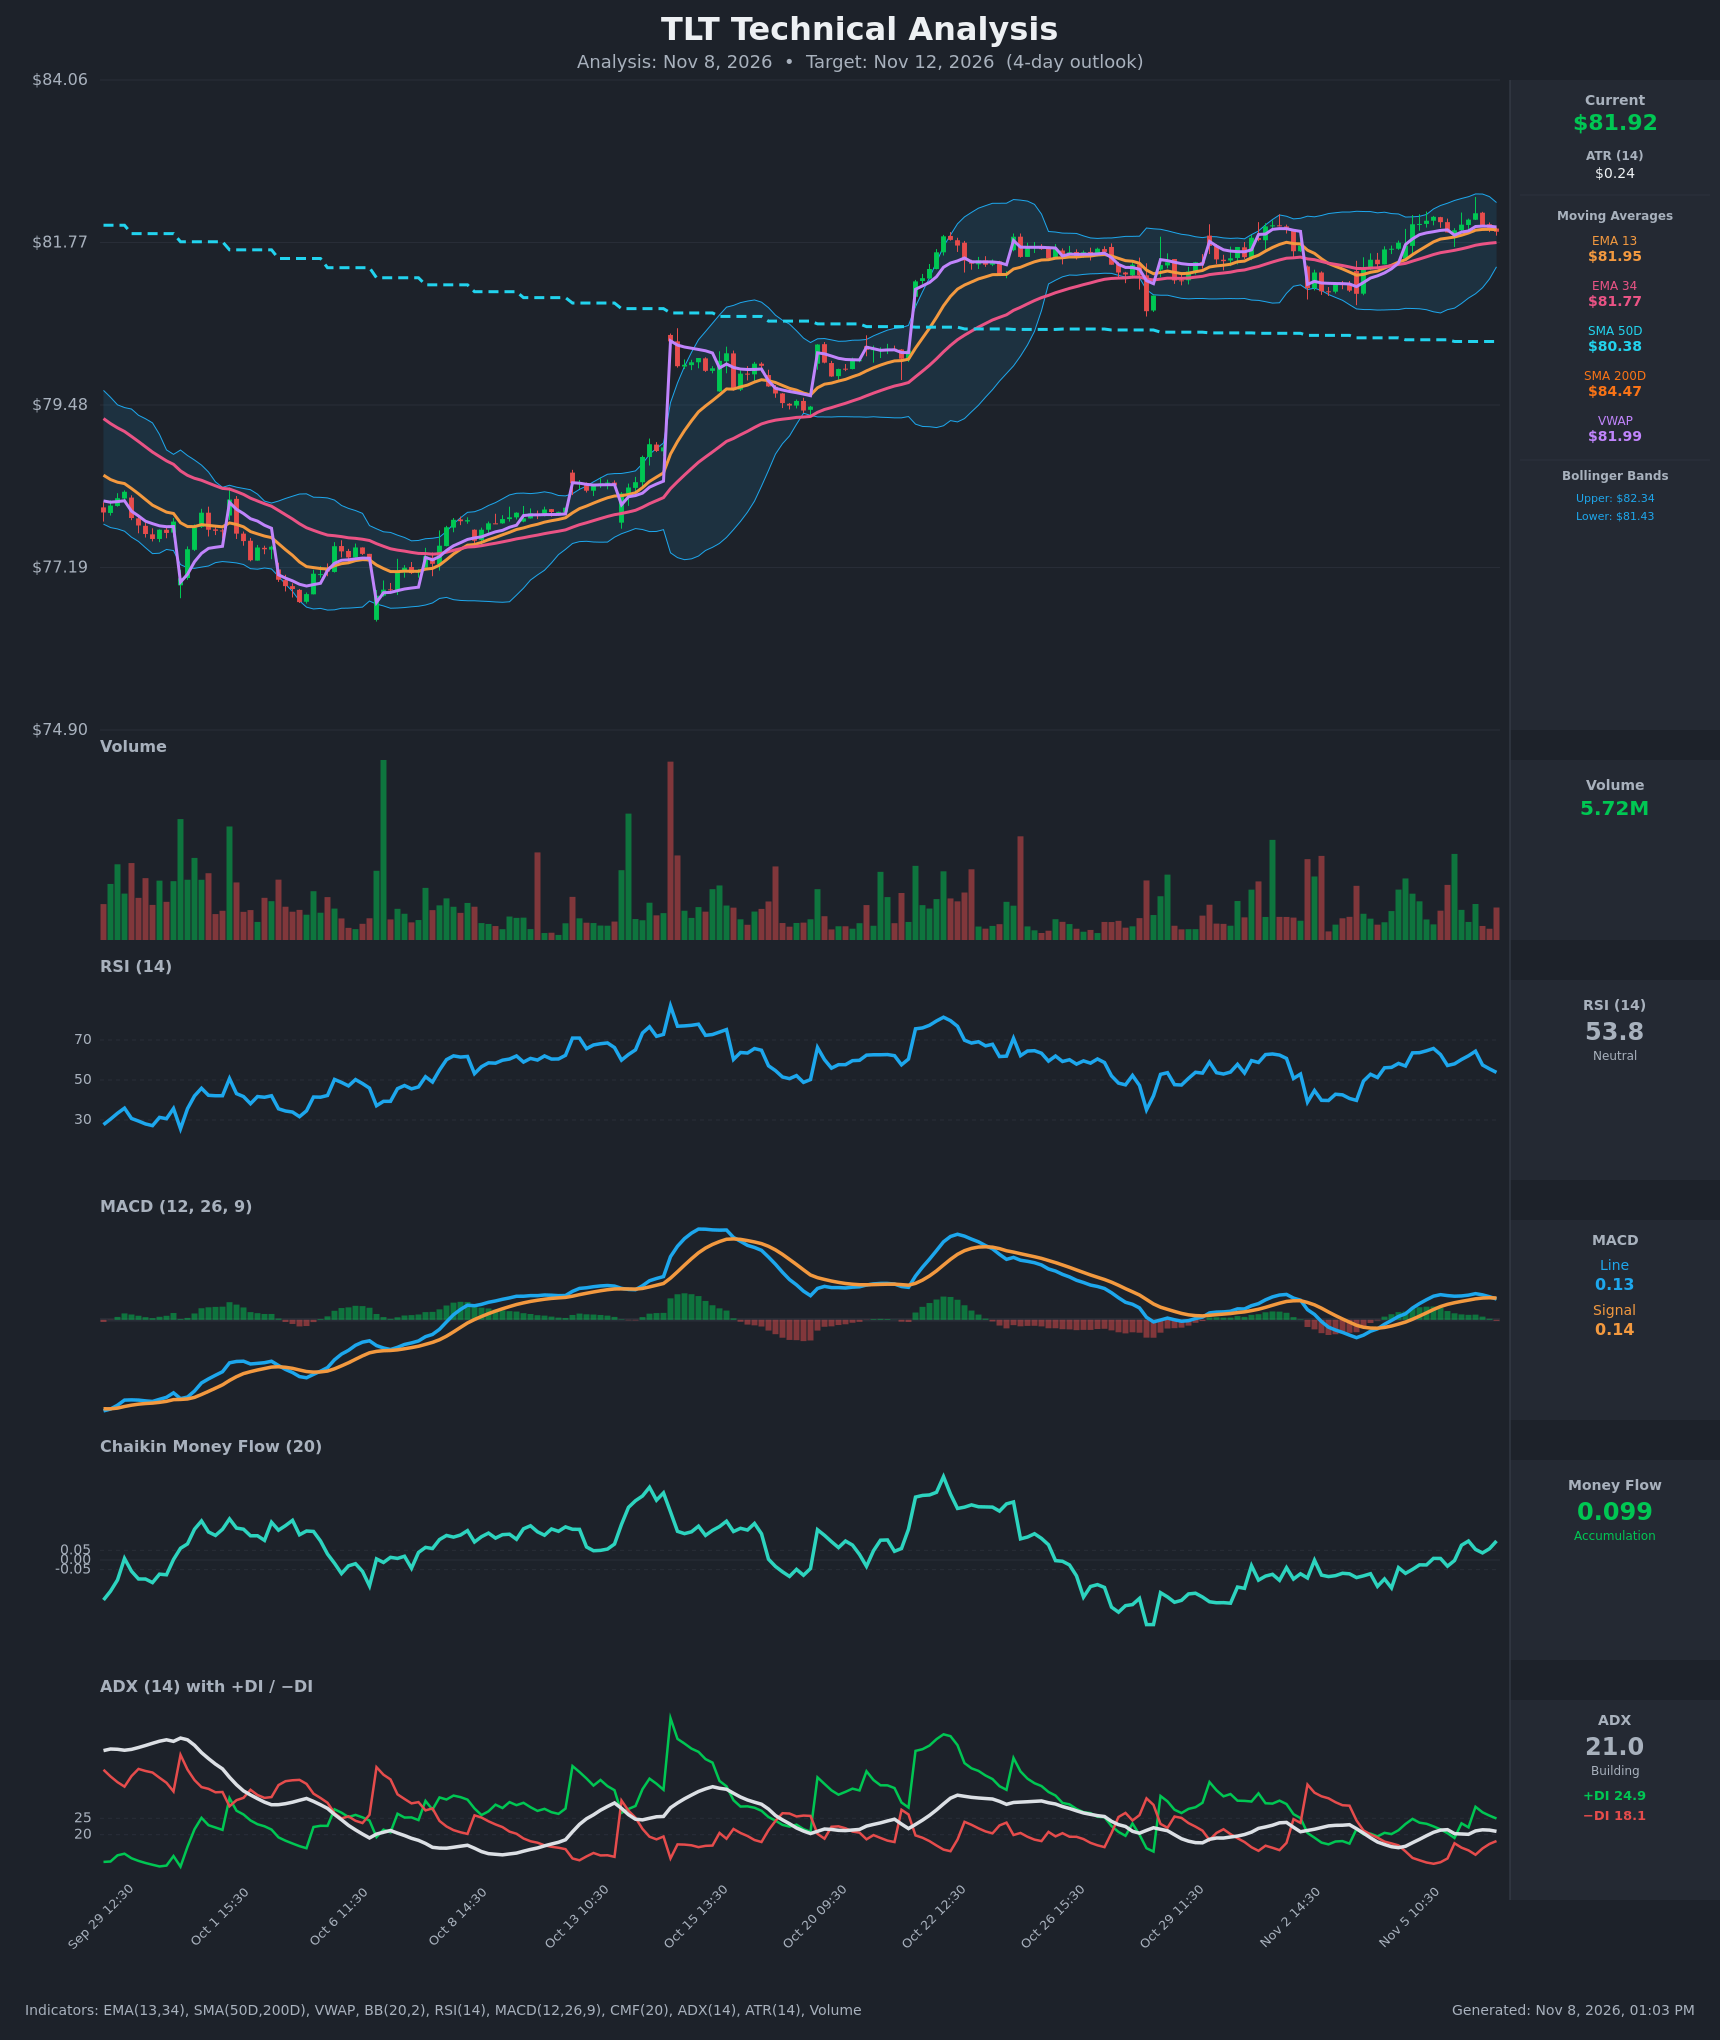
- RSI (14): 53.80, down from 64-66 on Nov 5-6 and back near the 50 midline. Momentum is fading but not weak, and there is no overbought or oversold condition. [Neutral]
- 20 EMA: The data gives EMA 13 at $81.95 and EMA 34 at $81.77. Price ($81.925) is just below the EMA 13 and above the EMA 34. EMA 13 is above EMA 34 with a modest spread, so the short-term trend is still up, and the EMA 34 is the first dynamic support. [Bullish]
- MACD: Line 0.131 vs signal 0.138. The line has just crossed below the signal, and the histogram has turned slightly negative after a plateau near 0.15-0.16. Both lines are positive, so this is a minor momentum fade rather than a trend reversal. [Bearish]
- Bollinger Bands (20): Upper $82.34, lower $81.43, middle about $81.88. Price sits at the middle band, and the bands have been expanding from a squeeze. Recent hourly highs near $82.2-82.3 were rejected at the upper band. [Neutral]
- CMF (20): 0.099, above the +0.05 threshold and recovering from negative readings in late October and early November. This shows modest accumulation. [Accumulation]
- ADX (14): 21.0, just above the 20 line and not yet above 25. +DI (24.9) is above −DI (18.1), so bulls are in control, but the trend is weak and only slightly building. [Weak Trend + Bullish direction]
- Volume: 5.72M, average to slightly below the recent big spikes. There is no volume surge confirming a breakout. Up-bars on Nov 5-6 had slightly better participation than the pullback bars. [Neutral to mildly supportive]
DIVERGENCES & TRENDS
- RSI made lower highs within the last session (65.8 to 64.4 to 53.8) while price held near $82. This is a mild short-term momentum divergence, and the MACD cross confirms it.
- The broader structure is constructive: higher lows since the early-November dip near $80.7, and price has recovered above both the EMA 13/34 and the SMA 50D ($80.38).
- CMF has turned from negative to positive, and +DI is clearly above −DI. Both support accumulation on pullbacks.
- The SMA 200D ($84.47) is far overhead and still declining. Price is below it, so the long-term trend remains down and rallies face major resistance. The SMA 50D is also sloping down, and there is no golden cross.
- VWAP ($81.99) sits just above price, a minor intraday resistance.
- The MACD bearish cross and the RSI drop warn of a pullback toward the EMA 34 or lower band before any push higher.
CHART PATTERNS
- Ascending Triangle / Bullish Flag-type consolidation (continuation): Highs are capped near $82.2-82.3 while lows are rising (the Nov 2-5 trough, then higher). A break above $82.34 would project a measured move of roughly $0.7-0.9 to about $83.0-83.2, though the pattern is small and not fully developed.
- The failure scenario resembles a Bearish Double Top around $82.2-82.3 (two recent rejections), with neckline support near $81.43-81.77. A close below that zone would target about $80.7-80.9.
- Neither pattern is confirmed, and the 4-day horizon favors a modest drift rather than a clean breakout.
POTENTIAL SCENARIOS
- Scenario 1: Bullish Ascending-Triangle Breakout Attempt — Buyers defend the EMA 34 and the CMF/+DI strength carries price through the upper band. Trigger: hourly close above $82.34 with volume above 6M. Target: $82.80-83.20. Invalidation: close below $81.43. (45% probability)
- Scenario 2: Bearish Pullback on MACD Cross — The MACD cross and falling RSI lead to a break of the EMA 34 and the lower band, with the double-top rejection near $82.3. Trigger: close below $81.70 and then $81.43. Target: $80.70-81.00. Invalidation: reclaim of $82.20. (35% probability)
- Scenario 3: Neutral Range Chop — ADX stays near 20 and price oscillates between $81.45 and $82.30. Trigger: failure to break either band. Target: $81.80-82.10. Invalidation: close outside $81.40-82.40. (20% probability)
PRICE TARGETS
Timeframe: 4 days (Nov 12, 2026). The range is sized at about 3.4% of price, between the 2-3 day and 7-10 day guidance.
- Target Price: $82.25
- Expected Range: $80.60 to $83.40 (width $2.80, about 3.4%)
- Key Levels: Support at $81.43 (lower Bollinger Band; EMA 34 at $81.77 is the first minor support), Resistance at $82.34 (upper Bollinger Band; the SMA 200D at $84.47 is the major overhead resistance)
OVERALL BIAS
OVERALL BIAS: BULLISH - Price is above the EMA 34 and SMA 50D with +DI over −DI and CMF in accumulation at 0.099, and higher lows point to an ascending-triangle push toward $82.25 or higher. The fresh MACD bearish cross and fading RSI temper conviction, so the edge is modest and a dip toward $81.43-81.77 is likely first.
This is educational analysis and not financial advice.