KWEB 6-day bearish forecast — Nov 8, 2026
- Bias: Bearish
- Timeframe: 6 days (made Nov 8, 2026, target date Nov 13, 2026)
- Price at analysis: $24.88
- Price target: $24.55
- Expected range: $23.95 – $25.35
- Result: Correct (-8.0%) — closed at $22.90 on Nov 13, 2026; quality score 54/100
Get a free AI analysis of KWEB today
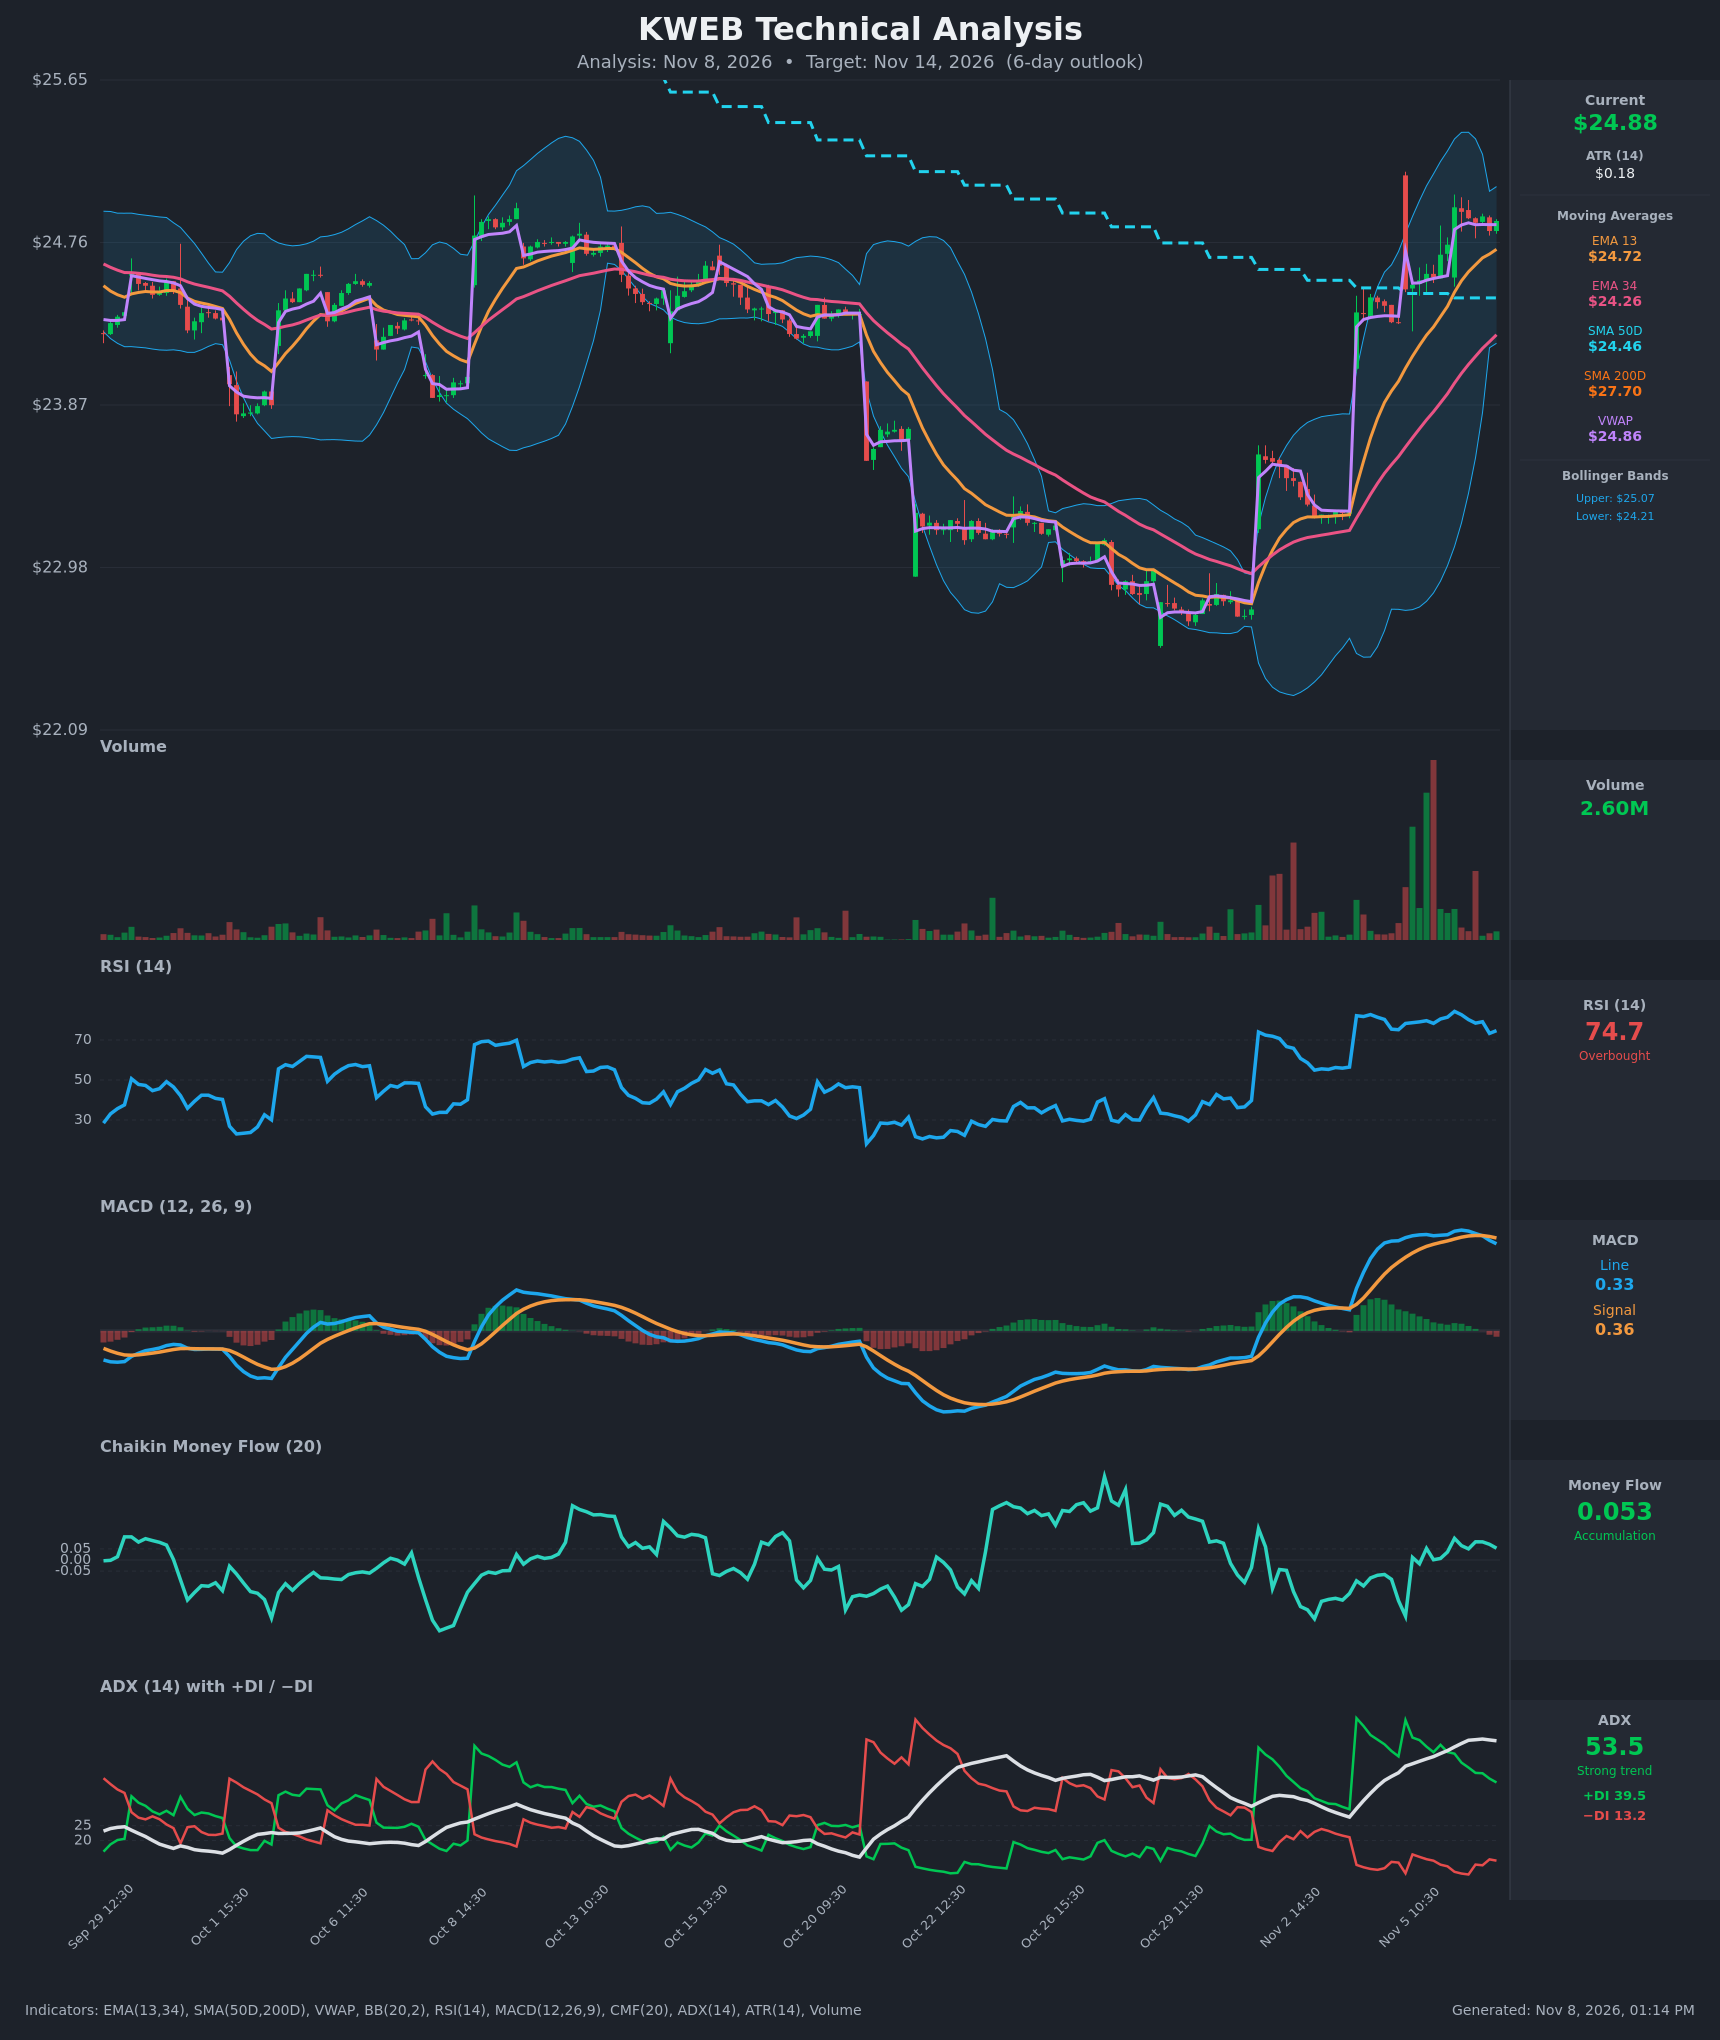
Analysis
TECHNICAL INDICATORS
- RSI (14): 74.68, still overbought but down from a peak of about 84 on Nov 6 open. It dropped from 79 to 73 and bounced to 74.7, so momentum is cooling from an extreme. [Bearish]
- 20 EMA: The data gives EMA 13 at $24.72 and EMA 34 at $24.26. Price at $24.88 is above both, and EMA13 is above EMA34 (bullish alignment) with both rising. Price is only about 0.6% above EMA13, so the gap is narrowing as price stalls. EMA13 is the first dynamic support. [Bullish]
- MACD: Line 0.334 vs signal 0.356. The line crossed below the signal on Nov 6 (about 13:30–14:30) and the histogram is now slightly negative at about -0.02. Both lines are still positive but rolling over from a peak of 0.387. [Bearish]
- Bollinger Bands (20): Upper $25.07, lower $24.21, with price near the upper half and the midline around $24.64. Price has failed to close outside the upper band and is hugging $24.82–$24.95. The bands are wide after the gap-up, so there is room for a mean-reversion move toward the midline. [Neutral]
- CMF (20): 0.053, barely above the +0.05 accumulation threshold. It has recovered from -0.25 on Nov 5 but has been fading from 0.098 to 0.053. Buying pressure is modest and weakening. [Neutral]
- ADX (14): 53.5 with +DI 39.5 and −DI 13.2. This is a very strong trend with bulls on top, but ADX has plateaued at 54 and +DI has fallen from 60 to 39.5. Readings above 50 often mark trend exhaustion and a pause. [Strong Trend – Bullish, but fading]
- Volume: 2.60M on the latest bar, well below the heavy spikes (the largest red and green bars) seen during the rally. Price is consolidating on declining volume, which suggests either a flag-type pause or a lack of fresh buyers. [Neutral]
DIVERGENCES & TRENDS
- RSI made its peak (84) at the Nov 6 open at $24.95. The latest price is nearly equal at $24.88, but RSI is about 10 points lower. This is momentum divergence, a mild bearish warning.
- The MACD bearish cross while price holds near highs adds to the momentum fade.
- The +DI decline from 60 to 39.5 with ADX flattening shows the thrust is decelerating even though the trend remains up.
- Price is above EMA13, EMA34, SMA50D ($24.46) and VWAP ($24.86), so short-term structure is intact. Price is still below SMA200D ($27.70), so the larger trend remains a downtrend and this is a counter-trend rally.
- SMA50D (about $24.46) is below SMA200D, so there is no golden cross and the long-term structure remains bearish.
- Price is just above VWAP ($24.86), which means buyers and sellers are balanced.
CHART PATTERNS
- Bullish Pennant/Flag (continuation): After the sharp rally from about $22.7 to $24.9, the tight sideways drift near $24.8–$24.95 resembles a small pennant. A break above $25.07 would target about $25.8–$26.0, using the flagpole.
- Possible Double Top (Bearish): Price has made two nearly equal highs around $24.95. A break below the neckline near $24.72 (EMA13) would target about $24.45–$24.50, the SMA50D area.
- The overall structure is a short-term rally within a larger downtrend, which makes failure at resistance more probable than a continuation toward the SMA200D at $27.70.
POTENTIAL SCENARIOS
- Scenario 1: Bearish Overbought Pullback — RSI cools off and MACD stays below its signal line. Price slips below EMA13 and mean-reverts toward the SMA50D/BB midline. Trigger: hourly close below $24.72. Target: $24.45–$24.55. Invalidation: close above $25.07. (45% probability)
- Scenario 2: Bullish Pennant Breakout — Consolidation resolves upward as strong ADX and +DI dominance carry the trend. Trigger: close above $25.07 on rising volume. Target: $25.60–$25.90. Invalidation: close below $24.46. (40% probability)
- Scenario 3: Neutral Sideways Digestion — Price chops between EMA13 and the upper band while indicators reset. Trigger: failure to break either $24.72 or $25.07. Target: $24.70–$25.00. Invalidation: decisive break of either level. (15% probability)
PRICE TARGETS
- Target Price: $24.55 (6 days)
- Expected Range: $23.95 to $25.35. The width is $1.40, or about 5.6% of the current price, which is appropriate for a 6-day horizon.
- Key Levels: Support at $24.46 (SMA50D, with EMA13 at $24.72 as the first minor cushion), Resistance at $25.07 (upper Bollinger Band)
OVERALL BIAS
OVERALL BIAS: BEARISH - RSI is overbought and fading from an extreme, MACD has crossed below its signal line, ADX is above 50 with +DI collapsing (exhaustion signs), and the rally is still below the falling SMA200D. A pullback toward the $24.45–$24.55 area is slightly more likely than a breakout.
This is educational analysis and not financial advice.