KWEB 4-day bullish forecast — Nov 8, 2026
- Bias: Bullish
- Timeframe: 4 days (made Nov 8, 2026, target date Nov 11, 2026)
- Price at analysis: $24.88
- Price target: $25.00
- Expected range: $24.40 – $25.35
- Result: Incorrect (-5.1%) — closed at $23.61 on Nov 11, 2026; quality score 3/100
Get a free AI analysis of KWEB today
Analysis
TECHNICAL INDICATORS
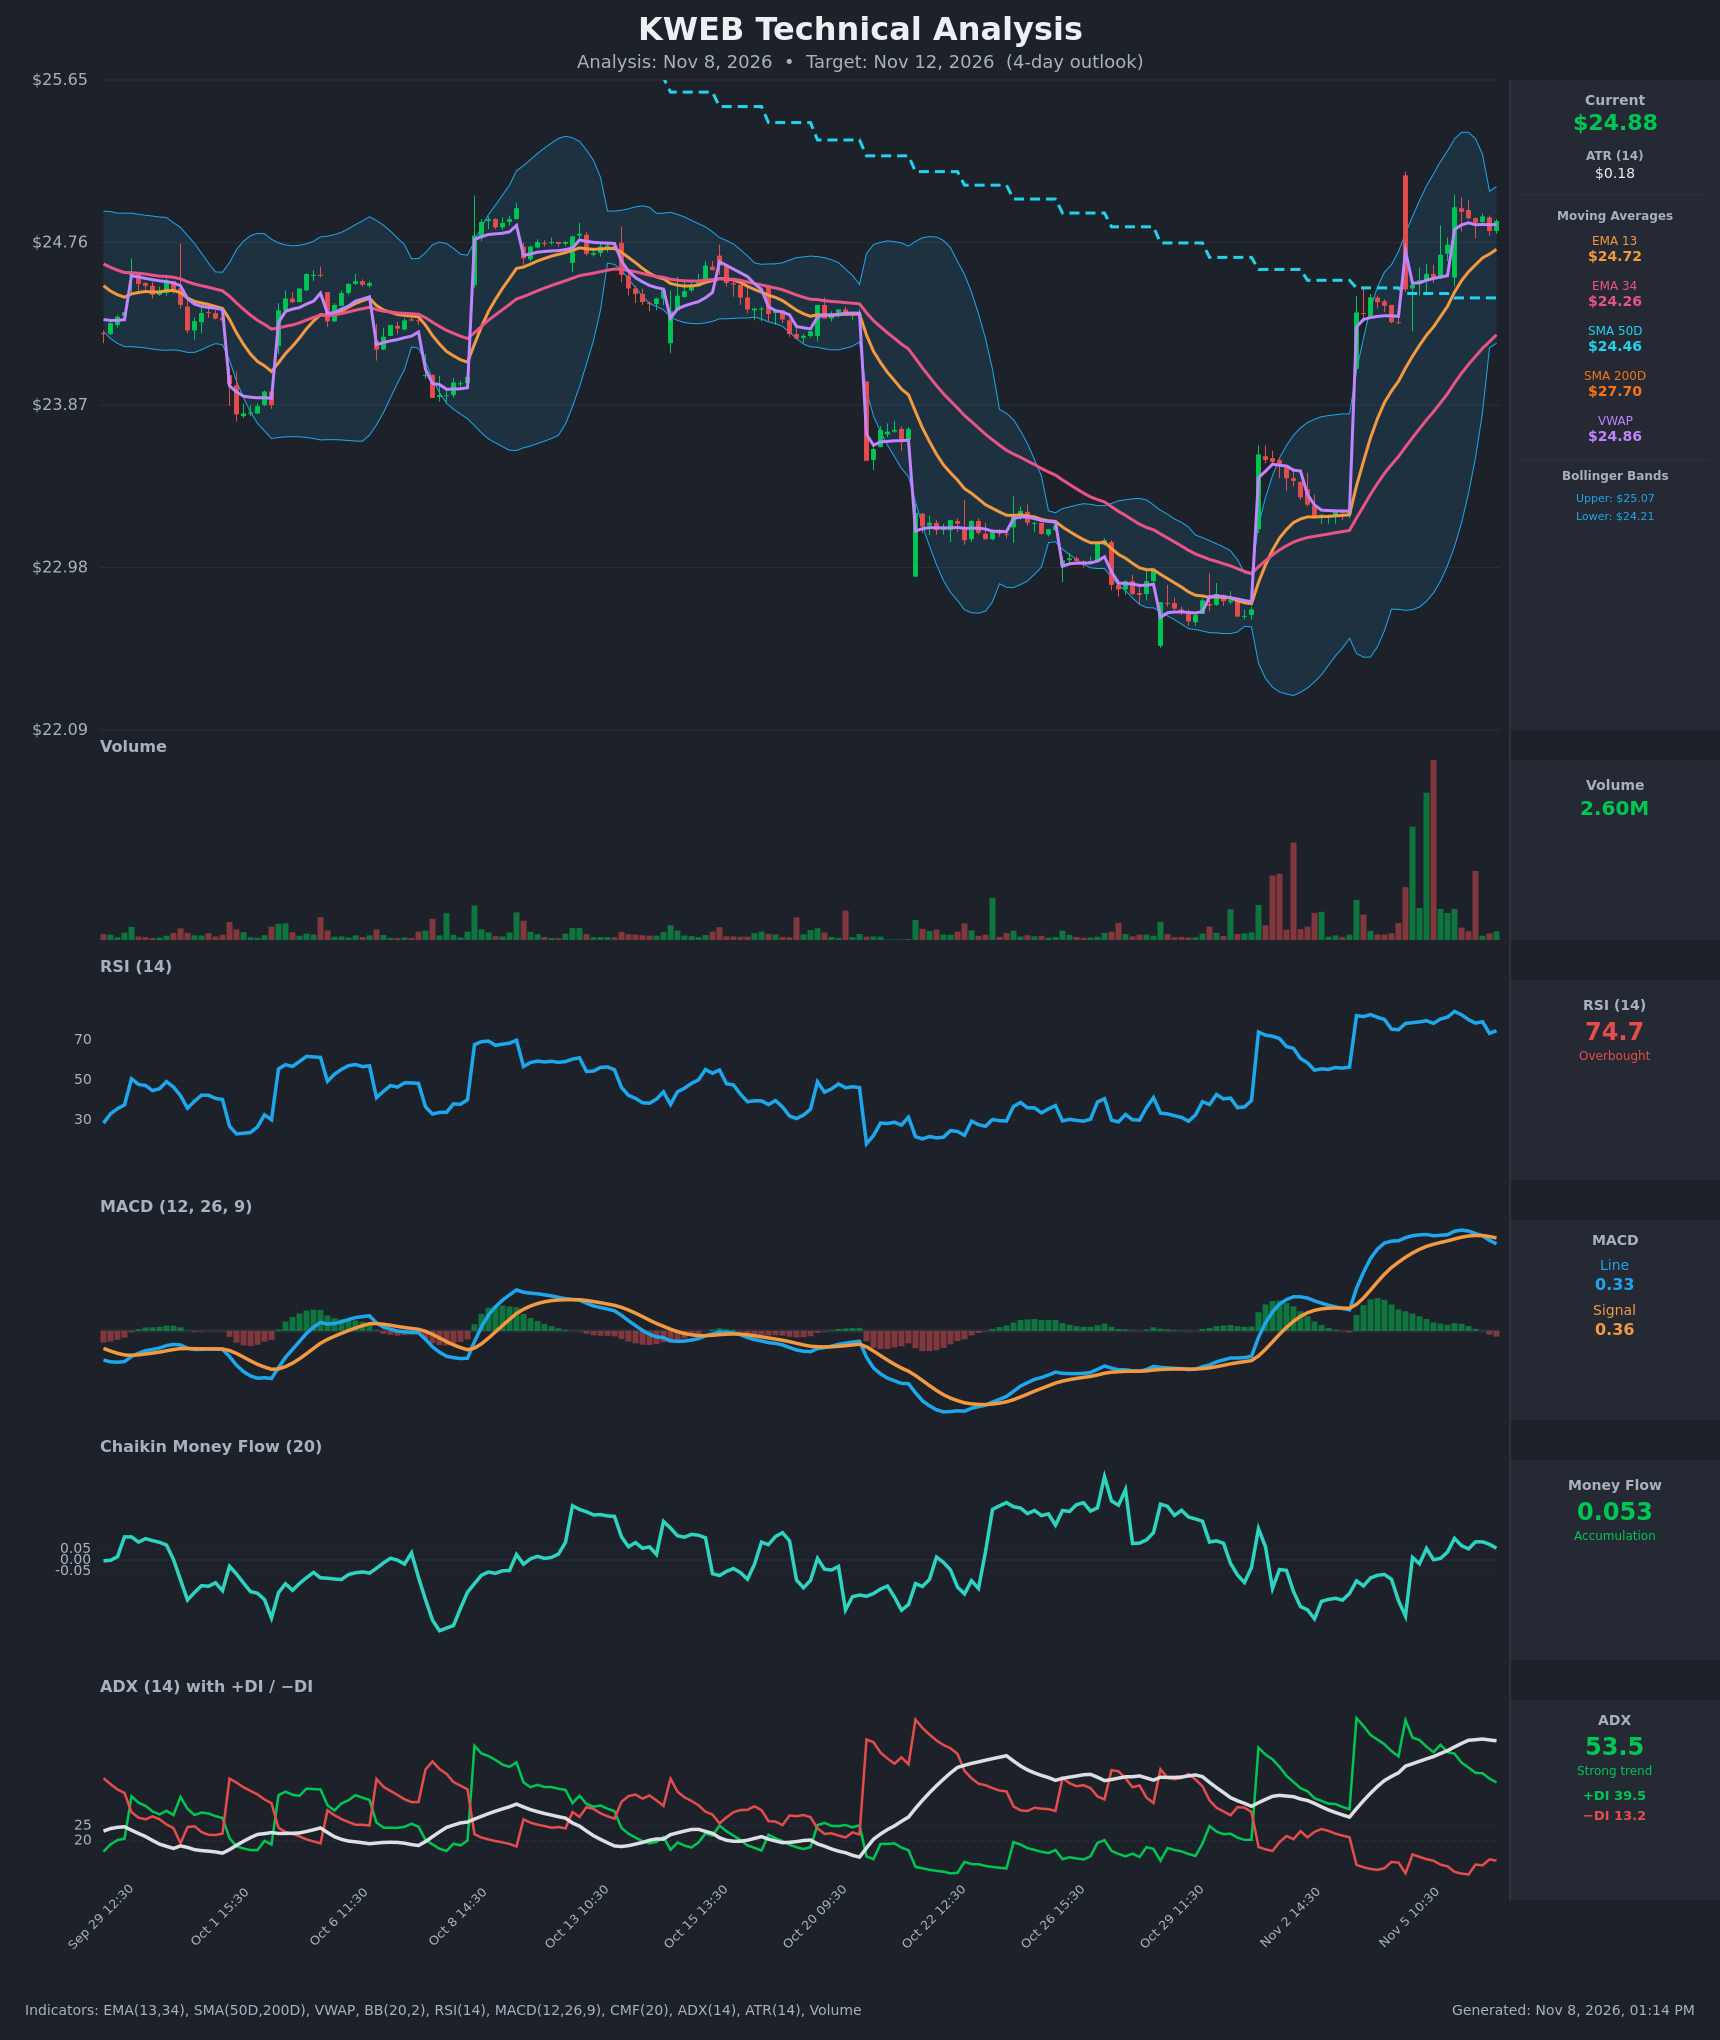
- RSI (14): 74.68, still overbought but down from a peak of 84.3 on Nov 6 at 09:30. It has made lower highs over the last several bars (84.3 → 79.1 → 74.7), so momentum is cooling even as price holds near its highs. [Neutral]
- 20 EMA: Only the EMA 13 ($24.72) and EMA 34 ($24.26) were provided, so these stand in for the 20 EMA. Price at $24.88 is above both, and EMA 13 is above EMA 34, a bullish stack. The EMA 13 is the first dynamic support, about $0.16 below price. [Bullish]
- MACD: The line (0.334) has crossed below the signal (0.356), and the histogram has turned slightly negative. The line peaked at 0.387 and has fallen for four bars, which is a short-term bearish momentum cross. Both lines remain well above zero, so the damage is limited. [Bearish]
- Bollinger Bands (20): Price is at $24.88 against an upper band of $25.07, a middle band of about $24.64 and a lower band of $24.21. It is in the upper quarter of the bands but no longer pressing the upper band. The bands are wide after the gap-up, and price is walking the upper half. [Bullish]
- CMF (20): 0.053, just above the +0.05 threshold. It has been positive for the last 10 bars after being negative on Nov 4–5, but it is only marginally in accumulation and not rising. [Accumulation]
- ADX (14): 53.5, a very strong trend, with +DI at 39.5 far above −DI at 13.2. ADX has flattened at 53.5–54.1 and +DI has fallen from 60.5 to 39.5. The trend is strong, but the pace of the advance is slowing. [Strong Trend + Bullish]
- Volume: The latest bar is 2.60M. The spike bars at the Nov 3–5 breakout were much heavier, with large red-volume candles near the top that suggest some supply. Volume has since faded during the sideways drift near $24.90, which is typical of consolidation and not outright distribution. [Neutral]
DIVERGENCES & TRENDS
- RSI and MACD momentum: Price is making equal-to-higher highs (about $24.95 on Nov 6) while RSI and MACD are making lower highs. This is mild bearish momentum divergence, a warning of short-term exhaustion and not a reversal signal by itself.
- DI spread: +DI has fallen from 60.5 to 39.5 while price stays elevated, showing fading buying thrust. The DI spread remains very wide, so bulls still control.
- MA structure: EMA 13 is above EMA 34 and price is above SMA50 ($24.46). Price is still far below SMA200 ($27.70), and SMA50 is below SMA200 (a death-cross regime). This is a counter-trend rally within a larger downtrend, and the $27.70 level is a distant ceiling.
- VWAP: Price ($24.88) is just above VWAP ($24.86), so buyers and sellers are about balanced intraday.
- Crossover: The MACD bearish crossover on the last bar is the key new signal. No DI crossover or EMA crossover is imminent.
CHART PATTERNS
- Bullish Flag / Pennant (continuation): After the sharp, high-volume vertical move from about $23.2 to $24.9, price has consolidated in a tight band of roughly $24.82–$24.95. This resembles the Bullish Flag / Pennant on the reference diagram. A breakout above about $24.95–$25.07 (the upper Bollinger Band) targets a measured move toward $25.4–$25.6 over time, and within 4 days a more modest $25.0–$25.2.
- Failure case: The flag fails if price loses the EMA 13 / VWAP zone ($24.72–$24.86). That would leave price in a wide range with the gap area around $24.4–$24.5 (SMA50 and mid-gap) as the downside magnet.
- Larger context: The rally is a V-shaped recovery from about $22.4, and no reversal pattern has completed.
POTENTIAL SCENARIOS
- Scenario 1: Bullish Flag Breakout / Trend Continuation — Price holds the EMA 13 / VWAP area, the overbought RSI resets through sideways action, and the strong ADX trend (+DI far above −DI) carries price through the upper band. Trigger: a close above $24.95–$25.07 with rising volume. Target: $25.00–$25.25. Invalidation: a close below $24.70. (45% probability)
- Scenario 2: Bearish Overbought Pullback — The bearish MACD crossover and RSI divergence lead to a mean-reversion pullback toward the rising EMA 13 and then the middle band. Trigger: a break below $24.72 (EMA 13) and then VWAP. Target: $24.40–$24.55. Invalidation: a reclaim of $24.95. (40% probability)
- Scenario 3: Neutral Consolidation — Price chops between $24.70 and $25.00 for the whole window while momentum indicators reset. Trigger: failure to break either side. Target: about $24.85. Invalidation: a decisive close outside $24.65–$25.05. (15% probability)
PRICE TARGETS
- Target Price: $25.00 (4-day)
- Expected Range: $24.40 to $25.35 (width $0.95, about 3.8% of current price, which fits the 4-day scaling between the 2–3 day and 7–10 day guidance)
- Key Levels: Support at $24.72 (EMA 13, followed by $24.46 SMA50), Resistance at $25.07 (upper Bollinger Band, followed by the recent high near $25.20)
OVERALL BIAS
OVERALL BIAS: BULLISH - The trend is very strong (ADX 53.5, +DI 39.5 vs −DI 13.2), price sits above the EMAs, VWAP and SMA50, and the tight consolidation resembles a bullish flag. The edge is modest because the MACD has crossed bearish and RSI is overbought, so a dip toward $24.72 is likely before any upside continuation.
This is educational analysis and not financial advice.