IWM 4-day bearish forecast — Nov 8, 2026
- Bias: Bearish
- Timeframe: 4 days (made Nov 8, 2026, target date Nov 11, 2026)
- Price at analysis: $273.64
- Price target: $272.00
- Expected range: $267.00 – $277.50
- Result: Incorrect (+3.3%) — closed at $282.59 on Nov 11, 2026; quality score 17/100
Get a free AI analysis of IWM today
Analysis
TECHNICAL INDICATORS
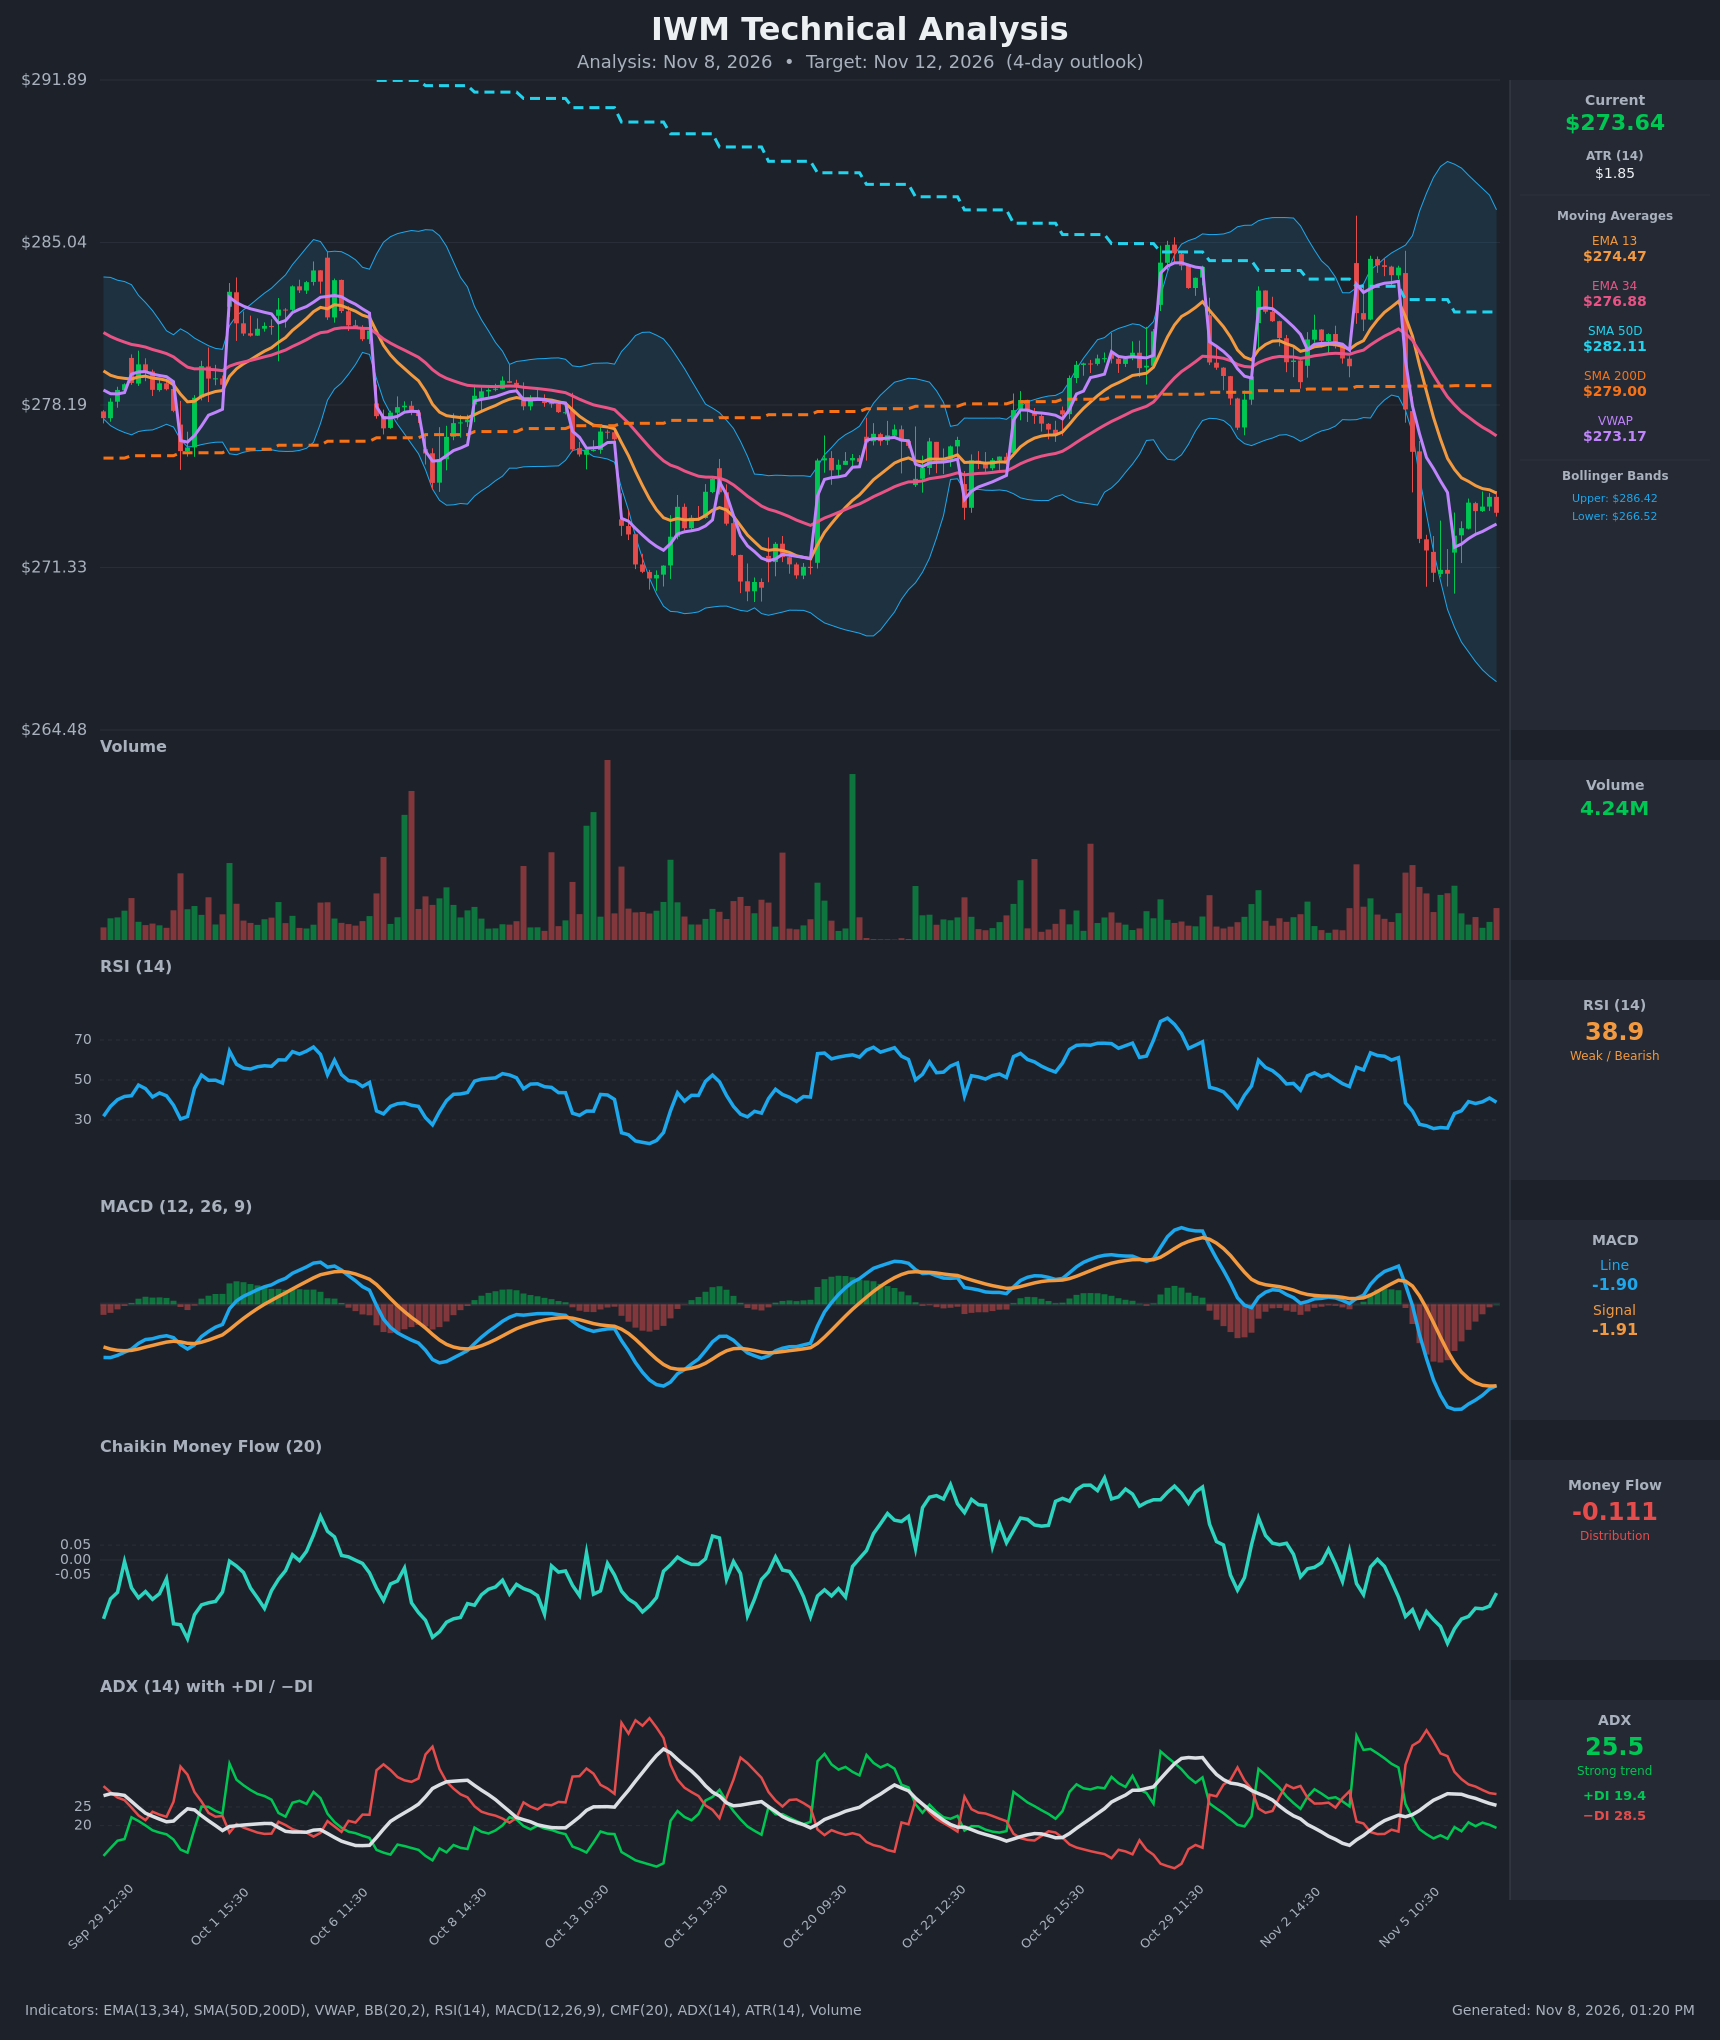
- RSI (14): 38.86, recovering from deeply oversold readings near 25-26 on Nov 5 but still below 50. Momentum is improving off the low, yet the reading remains in bearish territory. [Bearish]
- 20 EMA: The data gives EMA 13 at $274.47 and EMA 34 at $276.88. Price at $273.64 is below both, and both are sloping down, so they act as overhead resistance. EMA13 is below EMA34, a bearish alignment that formed Nov 5. [Bearish]
- MACD: Line -1.902 vs signal -1.912. The line is essentially touching the signal after rising from -2.46, so a bullish crossover is just forming. The histogram is near zero and turning positive, but both lines are deeply negative. [Neutral]
- Bollinger Bands (20): Upper $286.42, lower $266.52, midline about $276.5. Price is in the lower half, below the midline, after a sharp drop that hit near the lower band. The bands are wide after the volatility spike. A bounce toward the midline is possible, but price has not reclaimed it. [Bearish]
- CMF (20): -0.111, below -0.05, so distribution. It has ticked up from -0.281 but remains negative. [Distribution]
- ADX (14): 25.5, falling from 28.6, with -DI (28.5) above +DI (19.4). The trend is strong but fading, and the gap is narrowing. Bears are still in control. [Strong Trend - Bearish, weakening]
- Volume: 4.24M, which looks average to slightly elevated on the latest bar. The heavy volume came on the Nov 5 selloff, and the recent bounce is on lighter volume. That suggests the bounce lacks conviction. [Bearish-leaning]
DIVERGENCES & TRENDS
- RSI made a higher low (about 26 to 39) while price chopped sideways near $271-274. This is a mild bullish momentum improvement, not a full divergence.
- MACD is curling up toward a bullish crossover from deeply negative territory. This points to selling exhaustion, but it is a weak signal while below zero.
- EMA13 crossed below EMA34 on Nov 5 (a bearish cross). Price is below SMA50D ($282.11) and SMA200D ($279.00). SMA50D is above SMA200D, so there is no death cross, but price has lost both long-term averages.
- Price at $273.64 is slightly above VWAP ($273.17), a minor positive.
- The DI spread is narrowing (-DI fell from 45.6 to 28.5) and ADX is rolling over. The selloff impulse is fading and a consolidation is forming.
CHART PATTERNS
- After the sharp Nov 5 drop, price is forming a small consolidation near $271-274. This resembles a Bearish Flag/Pennant from the reference, a continuation pattern after a sharp decline, but it is loosely defined. A break below $271 would project toward about $266-267, near the lower Bollinger Band.
- The bounce off $271 with a double-bottom-like low (Nov 5 afternoon and Nov 6 open) hints at a Bullish Double Bottom. It needs a break above about $274.5-276 (EMA13/EMA34 cluster) to confirm, with a target near $279-280.
- The bearish structure is favored because price remains below all key moving averages and the bounce is on light volume.
POTENTIAL SCENARIOS
- Scenario 1: Bearish Flag Resolution Lower — Price fails at the EMA13/EMA34 resistance zone and resumes the downtrend, with -DI still dominant and CMF negative. Trigger: rejection at $274.50-$276 or a break below $271.00. Target: $269.00 (retest of $266.5-$271 area at the extreme). Invalidation: close above $277.00. (45% probability)
- Scenario 2: Bullish Relief Bounce — The MACD bullish cross, RSI recovery and double-bottom structure drive a mean-reversion bounce toward the Bollinger midline. Trigger: break above $275.00 with rising volume. Target: $277.50-$279.00 (EMA34 and SMA200D). Invalidation: break below $271.00. (30% probability)
- Scenario 3: Neutral Consolidation — Price chops between $271 and $275.50 as ADX fades. Trigger: failure to break either boundary. Target: $272-$275. Invalidation: a decisive close outside $271-$276. (25% probability)
PRICE TARGETS
For a 4-day timeframe, the range width should be roughly 3-6% of price. Range: $267.00 to $277.50 = $10.50 width, about 3.8%. This is consistent with the 4-day guidance and about 5.7 ATRs, which is reasonable.
- Target Price: $272.00 (4 days out, Nov 12)
- Expected Range: $267.00 to $277.50
- Key Levels: Support at $271.00, Resistance at $276.88
OVERALL BIAS
OVERALL BIAS: BEARISH - Price is below EMA13, EMA34, SMA50D and SMA200D, with -DI above +DI and CMF in distribution, while the bounce has come on light volume. The MACD cross and RSI recovery limit downside conviction, but bearish evidence outweighs them.
This is educational analysis and not financial advice.