IWM 6-day bearish forecast — Nov 8, 2026
- Bias: Bearish
- Timeframe: 6 days (made Nov 8, 2026, target date Nov 13, 2026)
- Price at analysis: $273.64
- Price target: $271.00
- Expected range: $265.50 – $278.50
- Result: Incorrect (+0.7%) — closed at $275.46 on Nov 13, 2026; quality score 50/100
Get a free AI analysis of IWM today
Analysis
TECHNICAL INDICATORS
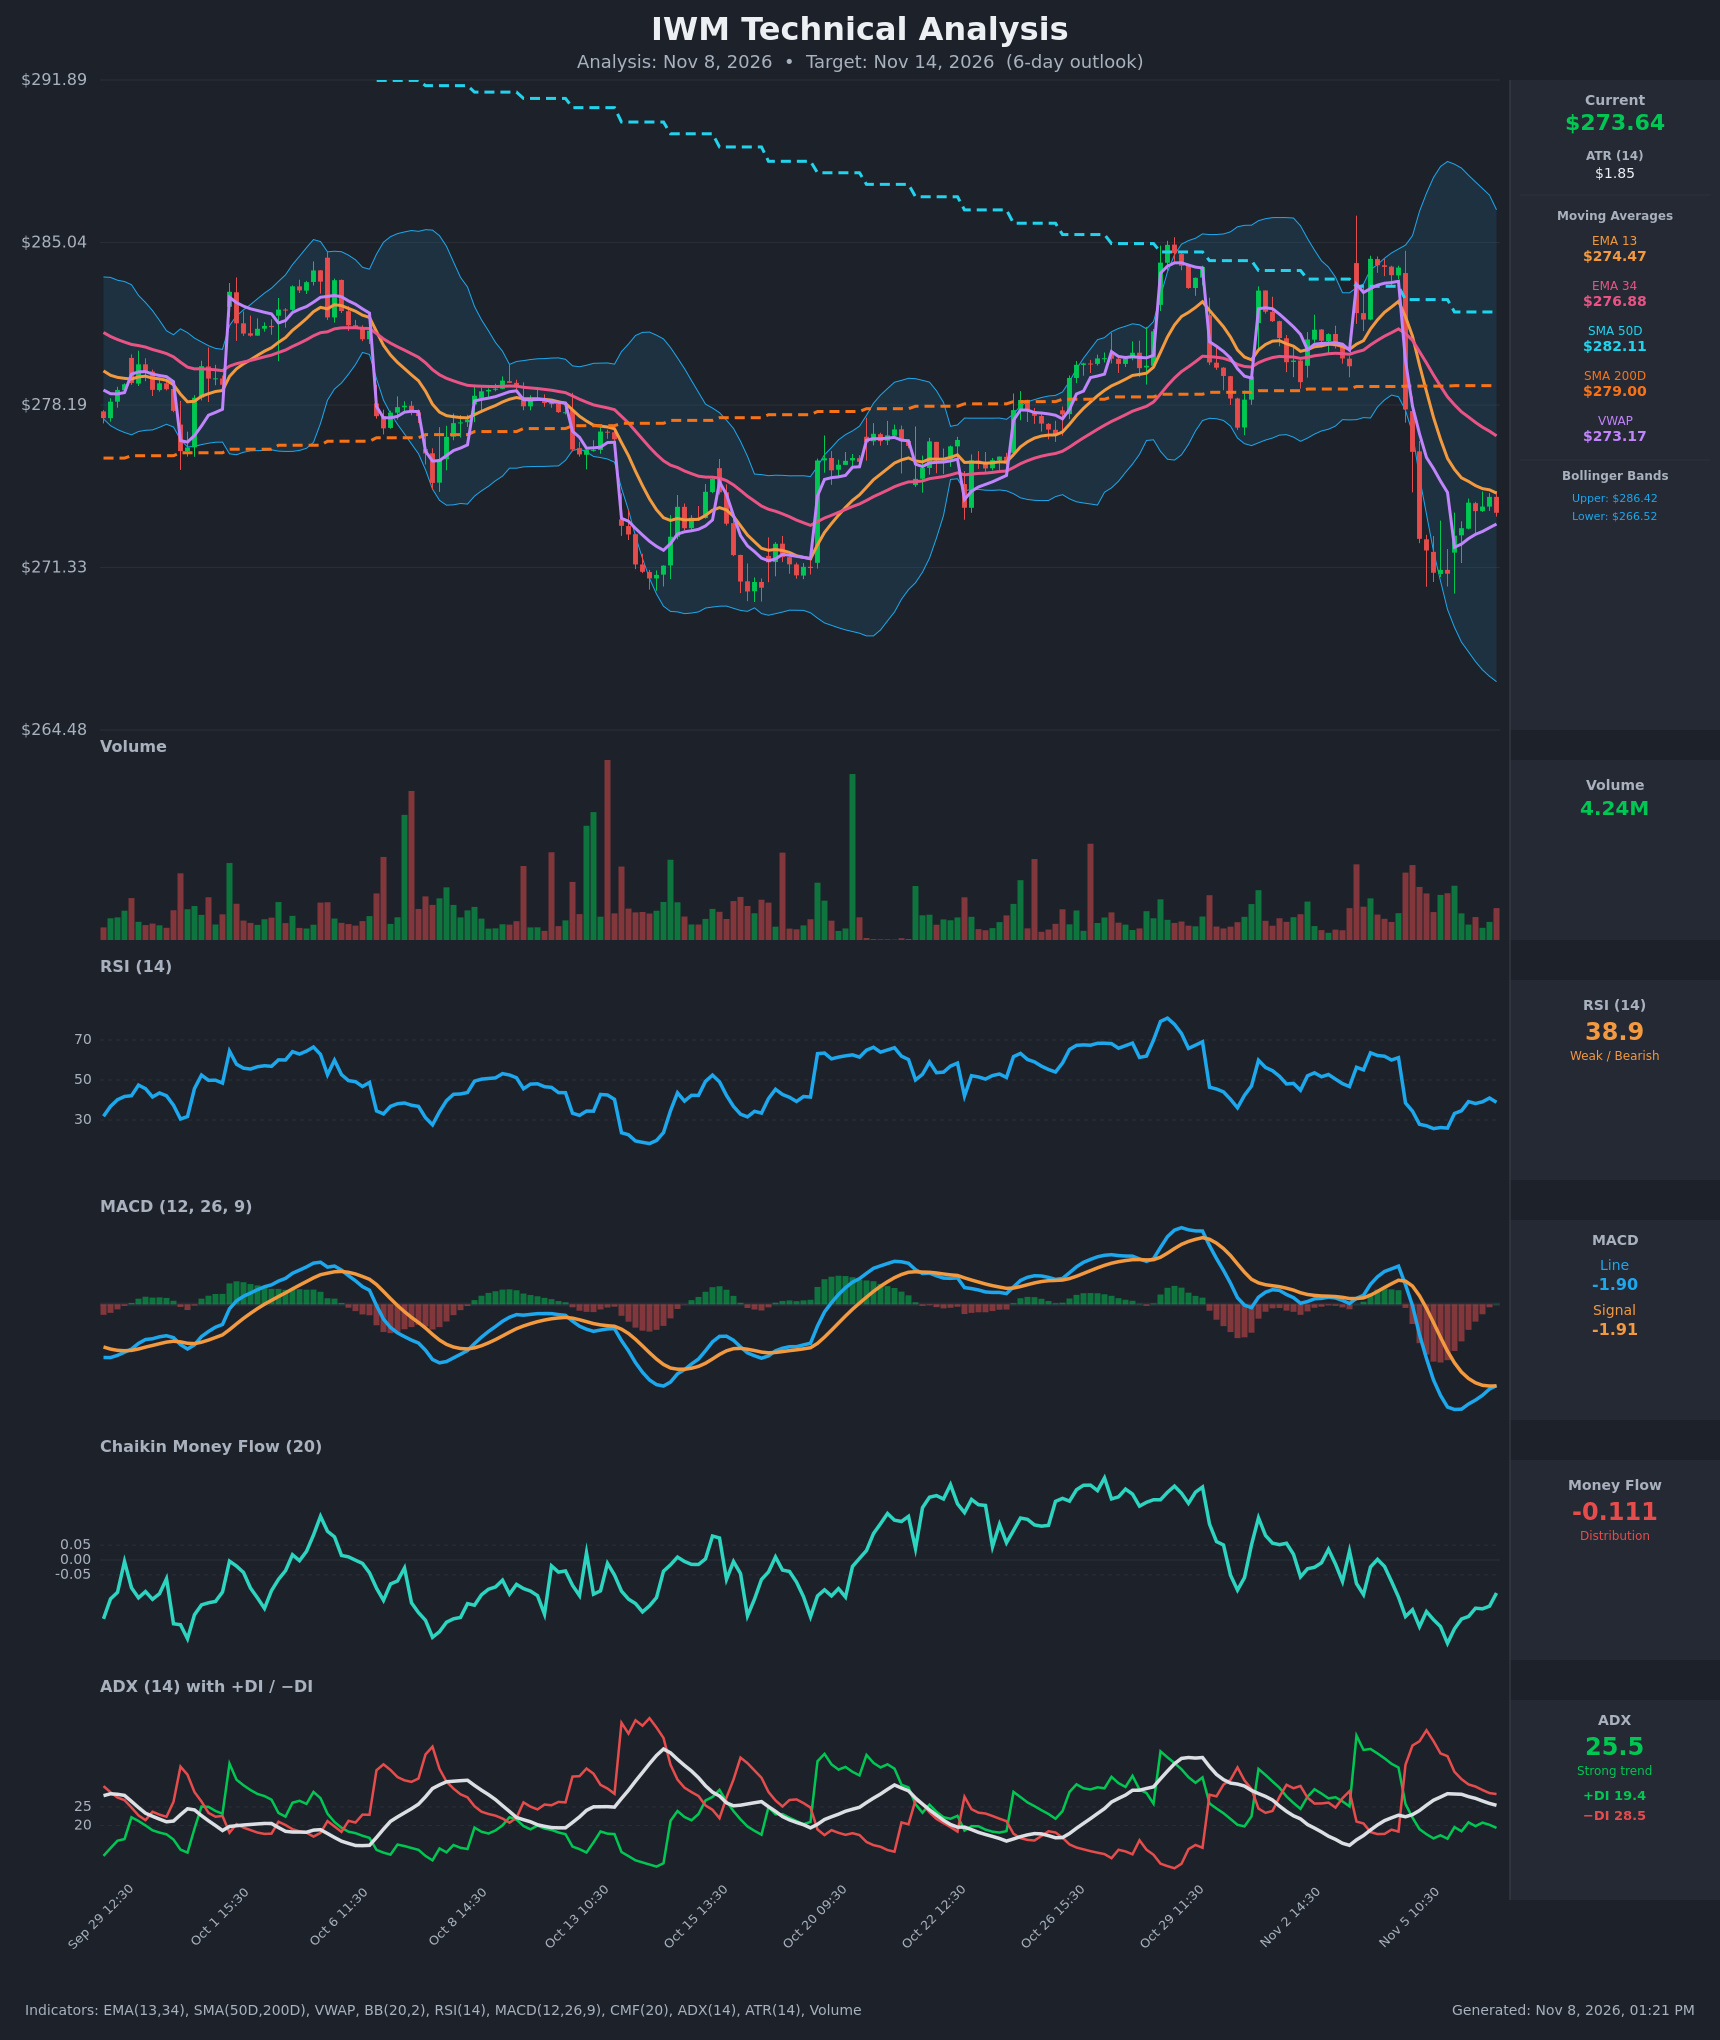
- RSI (14): 38.86. It bottomed near 25.7 on Nov 5 and has recovered to the high 30s, but it is still below 50 and has not regained the neutral midline. The bounce is modest. [Bearish]
- 20 EMA: The chart shows EMA 13 at $274.47 and EMA 34 at $276.88. Price ($273.64) sits below both, and both are sloping down. EMA13 crossed below EMA34 on Nov 5. The EMAs are overhead resistance. [Bearish]
- MACD: Line -1.902 vs Signal -1.912. The line is just barely above the signal after rolling up from -2.46, so a tiny bullish crossover is forming. Both lines are deeply negative and the histogram is about zero. This is a momentum stabilization, not a trend reversal. [Neutral]
- Bollinger Bands (20): Upper $286.42, lower $266.52, midline about $276.5. Price is in the lower half of the bands, roughly 36% of the way up, after a sharp selloff that pierced near the lower band. The bands are wide after the volatility spike. The midline at about $276.5 is resistance. [Bearish]
- CMF (20): -0.111, below the -0.05 threshold. It has been negative for several sessions and is only slightly improving from -0.281. This is persistent distribution. [Distribution]
- ADX (14): 25.5 with −DI (28.5) above +DI (19.4). ADX is just above 25 but falling from 28.6, so the downtrend is losing some strength. The −DI/+DI gap is narrowing (it was 45.6 vs 17.7). Bears still control. [Strong Trend – Bearish, fading]
- Volume: 4.24M. Volume spiked on the Nov 5 selloff and has faded on the rebound. The bounce is on lighter volume, so buyers lack conviction. [Bearish-leaning]
DIVERGENCES & TRENDS
- Momentum: RSI made a higher low (25.7 → ~26 → 38.9) and MACD has curled up from -2.46, so downside momentum is easing. This is short-term stabilization, not a confirmed bullish divergence.
- Trend structure:
- Price is below EMA13, EMA34, SMA50D ($282.11) and SMA200D ($279.00), a clear short-term downtrend.
- The Nov 5 gap-down broke through the SMA200D and the MA cluster.
- SMA50D has crossed above SMA200D earlier, but price is now below both.
- VWAP: Price ($273.64) is just above VWAP ($273.17), so there is mild intraday support from the rebound.
- ADX/DI: −DI remains above +DI, but the gap is closing, which suggests a consolidation or bounce phase.
- CMF: Still negative, so the bounce is not backed by accumulation.
CHART PATTERNS
- Bearish Flag / Pennant (continuation): After the sharp drop from ~$284 to ~$271, price has consolidated in a tight, slightly rising range ($271–$274.5). This resembles a bearish flag, and a breakdown below ~$271 would target roughly $265–$266 (the flag-pole measured move is ~$12, and it also coincides with the lower Bollinger Band).
- Bullish alternative: The decline is also consistent with a short-term oversold bounce toward the EMA34 / BB midline at $276–277, but this would likely be capped by the declining EMAs and the SMA200D at $279.
- No confirmed reversal pattern is visible yet. The chart has formed a lower high at ~$285 and now a lower low, consistent with a downtrend.
POTENTIAL SCENARIOS
- Scenario 1: Bearish Flag Breakdown — Price fails at the EMA13/EMA34 resistance zone and rolls over as −DI stays dominant and CMF stays negative. Trigger: Close below $271.00 (Nov 5 low area). Target: $267–$268, with an extension to the lower BB near $266.50. Invalidation: Close above $277. (50% probability)
- Scenario 2: Bullish Relief Bounce — The oversold RSI recovery and MACD crossover lead to a retest of the moving averages. Trigger: Break above $275 with rising volume. Target: $277–$279 (EMA34 and SMA200D). Invalidation: Close below $271. (30% probability)
- Scenario 3: Neutral Range Consolidation — Price chops between $271 and $276 as ADX fades and momentum resets. Trigger: Failure to break either $271 or $276. Target: $272–$275. Invalidation: Break of either boundary on a closing basis. (20% probability)
PRICE TARGETS
For a 6-day timeframe, the range width should be about 4–8% of the current price. The range of $265.50 to $278.50 is $13.00 wide, or 4.75%, which is within that guidance and consistent with ATR ($1.85) scaled over 6 days.
- Target Price: $271.00 (for the 6-day timeframe)
- Expected Range: $265.50 to $278.50
- Key Levels: Support at $271.00, Resistance at $276.88
OVERALL BIAS
OVERALL BIAS: BEARISH - Price is below all key moving averages, −DI leads +DI, CMF shows distribution, and the post-selloff bounce is on fading volume, consistent with a bearish flag. The MACD and RSI stabilization may allow a bounce toward $276–277, but a drift lower toward $271 and below is more likely.
This is educational analysis and not financial advice.