WMT 4-day bearish forecast — Nov 8, 2026
- Bias: Bearish
- Timeframe: 4 days (made Nov 8, 2026, target date Nov 11, 2026)
- Price at analysis: $125.47
- Price target: $123.90
- Expected range: $121.50 – $126.80
- Result: Correct (+0.3%) — closed at $125.83 on Nov 11, 2026; quality score 100/100
Get a free AI analysis of WMT today
Analysis
TECHNICAL INDICATORS
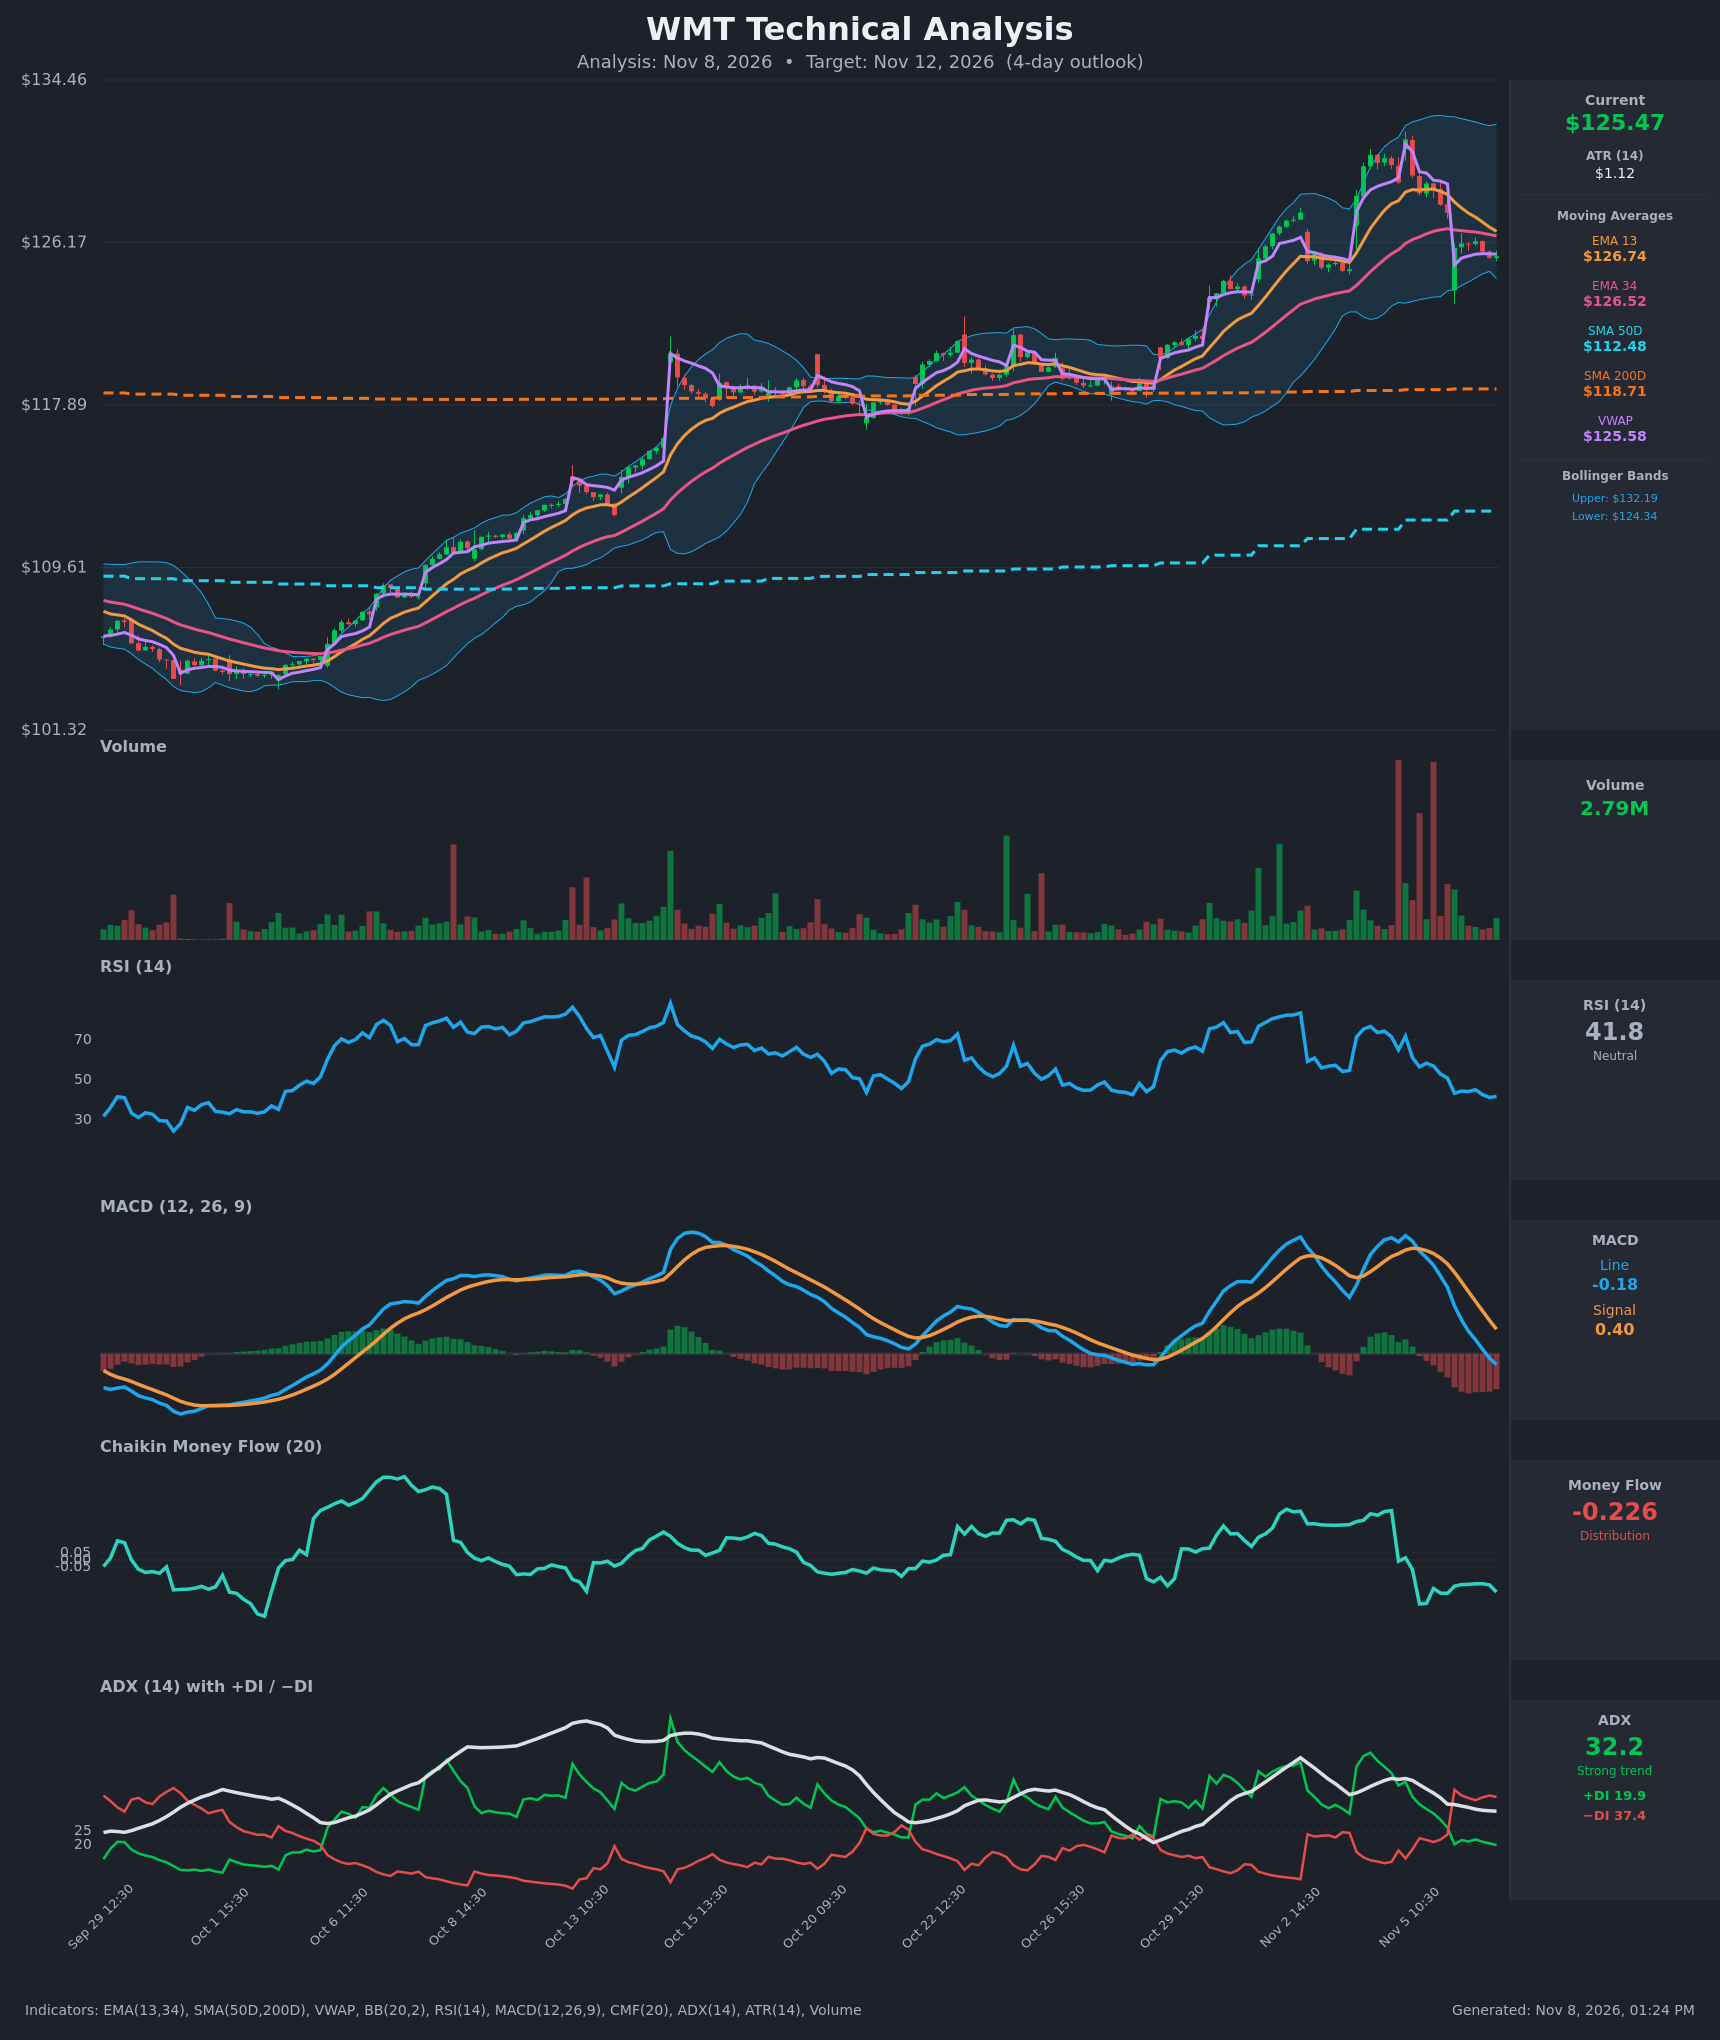
- RSI (14): 41.78, down from 71.9 on Nov 5 and now sitting below the 50 midline. Momentum is fading but not oversold (<30), so there is room to fall further. [Bearish]
- 20 EMA: The chart shows EMA 13 at $126.74 and EMA 34 at $126.52. Price at $125.47 is below both, so they act as overhead resistance. EMA13 is still just above EMA34, but the gap has narrowed from about $2.5 to $0.22. A bearish cross is imminent. [Bearish]
- MACD: Line -0.178, signal 0.401, histogram about -0.58 and widening. The line crossed below the signal on Nov 5 and has now gone negative. The histogram is expanding to the downside. [Bearish]
- Bollinger Bands (20): Upper $132.19, lower $124.34, midline around $128.3. Price at $125.47 is in the lower quarter of the band, after a sharp reversal from the upper band. The bands are wide, so volatility is elevated. The lower band is a nearby support and a bounce point, but a break below it would signal continuation. [Bearish]
- CMF (20): -0.226, well below the -0.05 threshold and falling from near zero on Nov 4. This is heavy distribution and selling pressure. [Distribution]
- ADX (14): 32.2, with -DI (37.4) well above +DI (19.9). The trend is strong and has flipped bearish, with the DI cross occurring on Nov 6 at the open. ADX has been declining from 44 as the prior uptrend ended, but the bears now control the direction. [Strong Trend – Bearish]
- Volume: The latest reading is 2.79M. Volume spiked on the Nov 5-6 selloff (large red bars) and has since calmed. Heavy volume on the decline confirms distribution, and the lighter recent volume suggests a pause or consolidation near $125-126. [Bearish – distribution confirmed]
DIVERGENCES & TRENDS
- No bullish divergence is present. RSI, MACD and CMF all made lower highs and are now trending down together, which confirms the price weakness.
- The MACD bearish crossover on Nov 5, followed by the line dropping below zero, shows momentum turning decisively.
- The -DI/+DI crossover on Nov 6 (-DI 40 vs +DI 20) and the RSI break below 50 confirm the shift.
- Price lost the EMA13/34 and VWAP ($125.58) on a gap-down on Nov 6. It is now hovering right at VWAP, so VWAP is the immediate pivot.
- Long-term structure is still bullish. Price is well above SMA50D ($112.48) and SMA200D ($118.71), and the 50D remains below the 200D but is converging on it, so no golden cross is imminent. This is a short-term pullback inside a larger uptrend.
- A bearish EMA13/EMA34 cross is nearly complete.
CHART PATTERNS
- Bearish Head and Shoulders / Double Top (loosely): The Oct 29 – Nov 5 advance produced two peaks near $131 and then a sharp breakdown. This is an early topping structure. The Nov 6 gap down through the EMAs resembles a break of the neckline area around $126.
- Bearish Flag/Pennant (tentative): The small, tight consolidation at $125.4-$126.2 after the gap down looks like a bearish flag. A break lower would project roughly a $2-3 measured move toward $122-123.
- The target for the double top/gap breakdown is the Oct 26 – Nov 2 base near $121-$123. The SMA200D at $118.71 is the larger measured-move area.
POTENTIAL SCENARIOS
- Scenario 1: Bearish Continuation Lower — The gap-down, MACD cross, -DI dominance and CMF distribution point to continued selling. The bear flag breaks down through the lower Bollinger Band and VWAP. Trigger: close below $124.30 (lower BB). Target: $122.50-$123.50, with an extension toward $121. Invalidation: close back above $127.00 (EMA13/34 zone). (55% probability)
- Scenario 2: Neutral Consolidation / Oversold Bounce — Price holds the lower BB and VWAP area and chops between $124.30 and $127. Trigger: hold above $124.30 with stable volume. Target: $125-$126.50. Invalidation: break below $124.30 or above $127.50. (25% probability)
- Scenario 3: Bullish Recovery — Buyers defend the dip in the long-term uptrend, and price reclaims the EMAs. Trigger: close above $127.00 with rising volume. Target: $128.50-$129.50. Invalidation: close below $124.30. (20% probability)
PRICE TARGETS
- Target Price: $123.90 (4-day horizon)
- Expected Range: $121.50 to $126.80 (width $5.30, about 4.2% of current price, consistent with the 2-4% / up to ~5% guidance for a 4-day window, with extra width because ATR is $1.12 and the trend is elevated)
- Key Levels: Support at $124.30 (lower Bollinger Band), with deeper support at $121.50. Resistance at $126.74 (EMA13 / EMA34 zone).
OVERALL BIAS
OVERALL BIAS: BEARISH - MACD crossed bearish and went negative, -DI dominates +DI with ADX at 32, CMF at -0.226 shows heavy distribution, and price is below the EMAs after a gap-down from the $131 high. Support is likely to be tested near $124.30, with downside extension to about $123.90.
This is educational analysis and not financial advice.