WMT 6-day bearish forecast — Nov 8, 2026
- Bias: Bearish
- Timeframe: 6 days (made Nov 8, 2026, target date Nov 13, 2026)
- Price at analysis: $125.47
- Price target: $123.90
- Expected range: $120.60 – $127.40
- Result: Incorrect (+2.0%) — closed at $127.93 on Nov 13, 2026; quality score 42/100
Get a free AI analysis of WMT today
Analysis
TECHNICAL INDICATORS
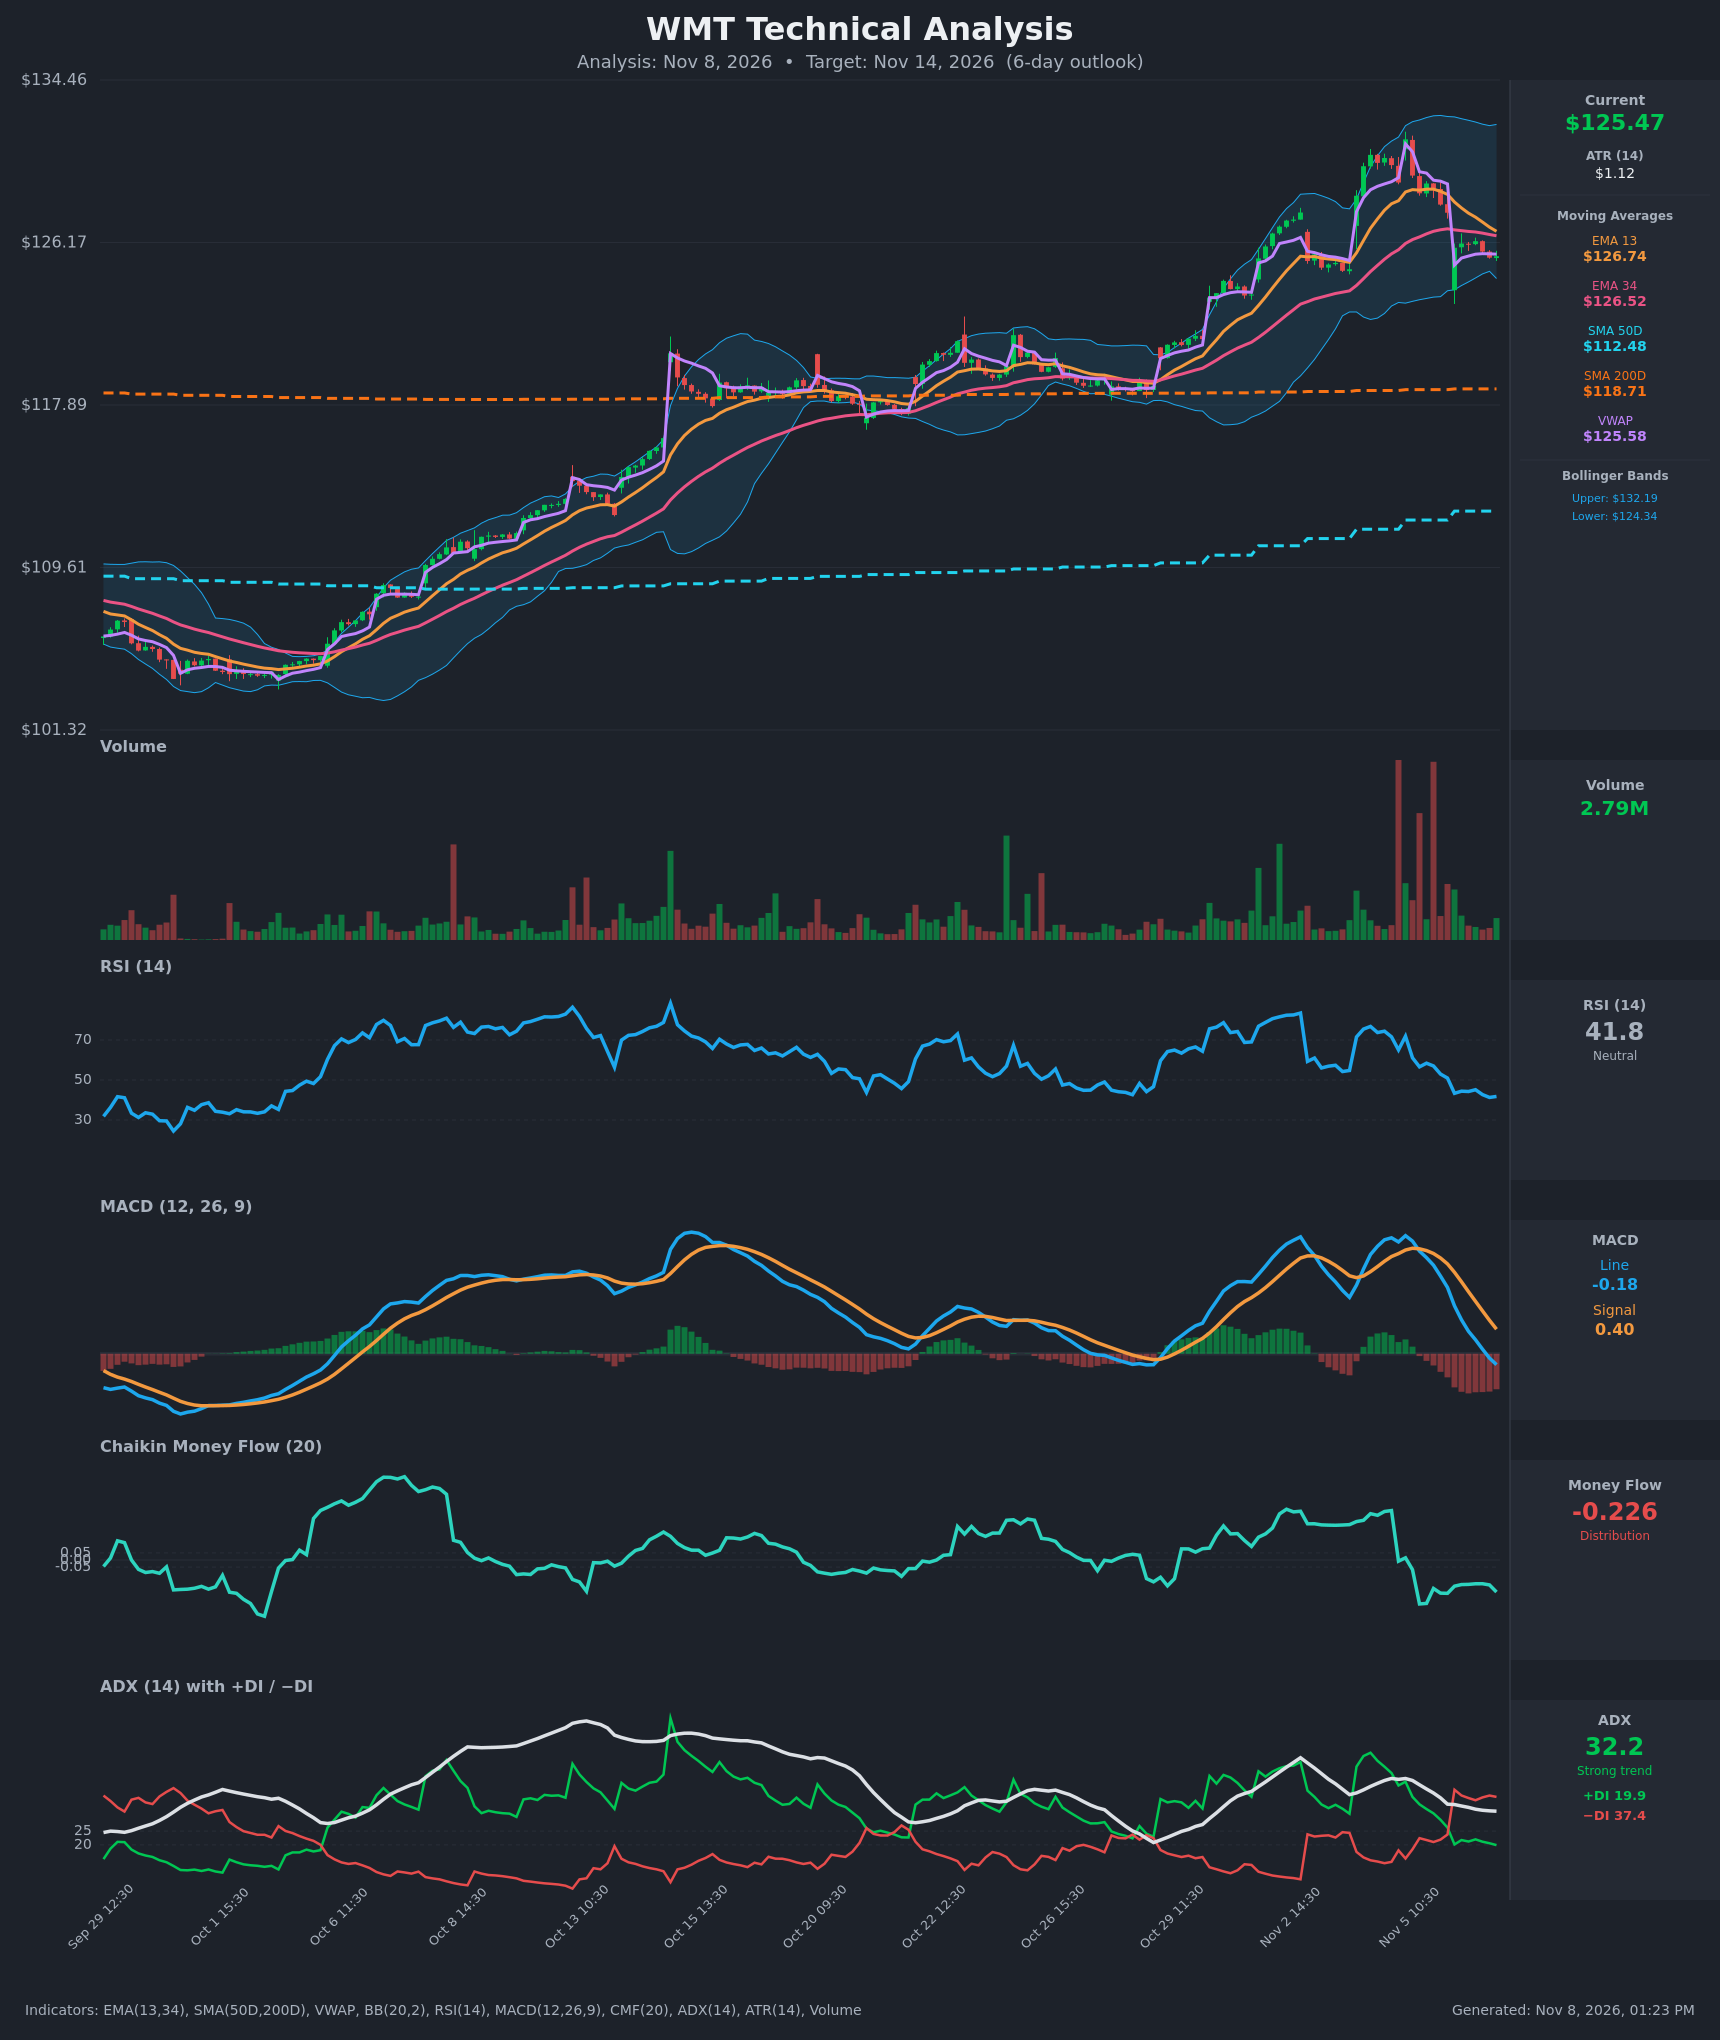
- RSI (14): 41.78, down from 71.9 on Nov 5 and now below the 50 midline. Momentum is fading but RSI is not yet oversold (<30), so there is room for further downside. [Bearish]
- 20 EMA: The chart gives EMA 13 at $126.74 and EMA 34 at $126.52. Price at $125.47 is below both, and EMA 13 is about to cross below EMA 34 (the gap is only $0.22). Both averages are now overhead resistance. [Bearish]
- MACD: The line (-0.178) crossed below the signal (0.401) and is now negative. The histogram is deeply negative, about -0.58, and still expanding. This is a clear bearish crossover with accelerating downside momentum. [Bearish]
- Bollinger Bands (20): Upper $132.19, lower $124.34, midline about $128.26. Price at $125.47 is in the lower quarter of the bands, about $1.13 above the lower band. It has fallen from near the upper band, and the bands are still wide after the earlier expansion. A test of the lower band is plausible. [Bearish]
- CMF (20): -0.226, well below -0.05, and it fell sharply from slightly positive levels on Nov 5. This is strong distribution, with selling on heavy volume during the Nov 5-6 drop. [Distribution]
- ADX (14): 32.2, a strong trend, but it is declining from 44. −DI (37.4) is far above +DI (19.9), and −DI re-crossed above +DI on Nov 6. Bears control the short-term trend. [Strong Trend – Bearish]
- Volume: The latest bar is 2.79M, modest. The large red volume spikes came during the sell-off from the Nov 5 high (~$131), which shows distribution. The bounce since then has come on lighter volume. [Bearish – selling volume dominates]
DIVERGENCES & TRENDS
- No bullish divergence is present. RSI, MACD and CMF are all making lower highs and lower lows alongside price.
- MACD rolled over from a high peak while price made a marginal new high near $131. That was a mild bearish divergence that has now played out.
- The Nov 6 09:30 gap down from $127.69 to $125.91 reset VWAP and moved −DI sharply above +DI. This was a decisive shift in control.
- Price has stabilized around $125.4–126.2 for the last 6 bars. That is a minor pause, but the indicators are still deteriorating.
- Long-term structure remains bullish: price is above SMA50D ($112.48) and SMA200D ($118.71), and SMA50D is rising toward the 200D. The medium-term uptrend is intact, but a pullback is under way.
- EMA 13 is about to cross below EMA 34, a bearish short-term crossover.
- Price is slightly below VWAP ($125.58), a marginally bearish reading.
CHART PATTERNS
- Bearish Rising Wedge / Double Top (loose): The rally from early October topped near $131 and has been followed by a sharp breakdown and a weak consolidation. This resembles a topping structure rather than a clean pattern.
- Bearish Flag/Pennant (developing): The sharp drop from $131 to $125.4 is followed by a tight sideways drift of about $0.8 range. A break below $125.0 would project roughly $5–6 lower on a measured move, but over 6 days a more modest decline is realistic.
- Key support is the lower Bollinger Band at about $124.34. Beneath it are the Nov 6 gap-low area near $122.5–123 and the Oct 29 base around $120–121. The SMA200D at $118.71 is a major long-term level.
POTENTIAL SCENARIOS
- Scenario 1: Bearish Continuation Lower — Distribution, a bearish MACD cross, −DI dominance and price below the EMAs favor further selling toward the lower Bollinger Band and the gap-fill area. Trigger: break below $124.80 (the Nov 6 range low and the lower band). Target: $122.50–123.50. Invalidation: close back above $127.00 (EMA cluster). (55% probability)
- Scenario 2: Neutral Consolidation/Base — Price holds the $124.3–127.0 range as RSI resets, with an oversold bounce limited by overhead EMAs. Trigger: lower band holds on a retest. Target: $124.50–126.50. Invalidation: a decisive break outside $124.00–127.50. (25% probability)
- Scenario 3: Bullish Relief Bounce — The long-term uptrend reasserts and the lower band acts as support, leading to a retest of the EMA cluster and VWAP. Trigger: reclaim of $126.8 on rising volume. Target: $128.00–128.50 (Bollinger midline). Invalidation: close below $124.30. (20% probability)
PRICE TARGETS
- Target Price: $123.90 (6-day)
- Expected Range: $120.60 to $127.40 (width $6.80 ≈ 5.4% of current price, in line with the ~4–8% guide for a 7–10 day horizon, scaled slightly down for 6 days)
- Key Levels: Support at $124.34 (lower Bollinger Band; deeper support $122.50), Resistance at $126.74 (EMA 13 / EMA 34 cluster, about $126.5–126.7)
OVERALL BIAS
OVERALL BIAS: BEARISH - MACD has crossed bearish with an expanding negative histogram, −DI (37.4) dominates +DI (19.9) with ADX still strong at 32, CMF at -0.226 shows heavy distribution, and price sits below the converging EMA 13/34 and VWAP. The broader uptrend above the SMA200D should limit the downside to the $122–124 area rather than a collapse.
This is educational analysis and not financial advice.