QCOM 4-day bullish forecast — Nov 8, 2026
- Bias: Bullish
- Timeframe: 4 days (made Nov 8, 2026, target date Nov 11, 2026)
- Price at analysis: $165.59
- Price target: $168.00
- Expected range: $162.00 – $170.00
- Result: Correct (+4.8%) — closed at $173.51 on Nov 11, 2026; quality score 70/100
Get a free AI analysis of QCOM today
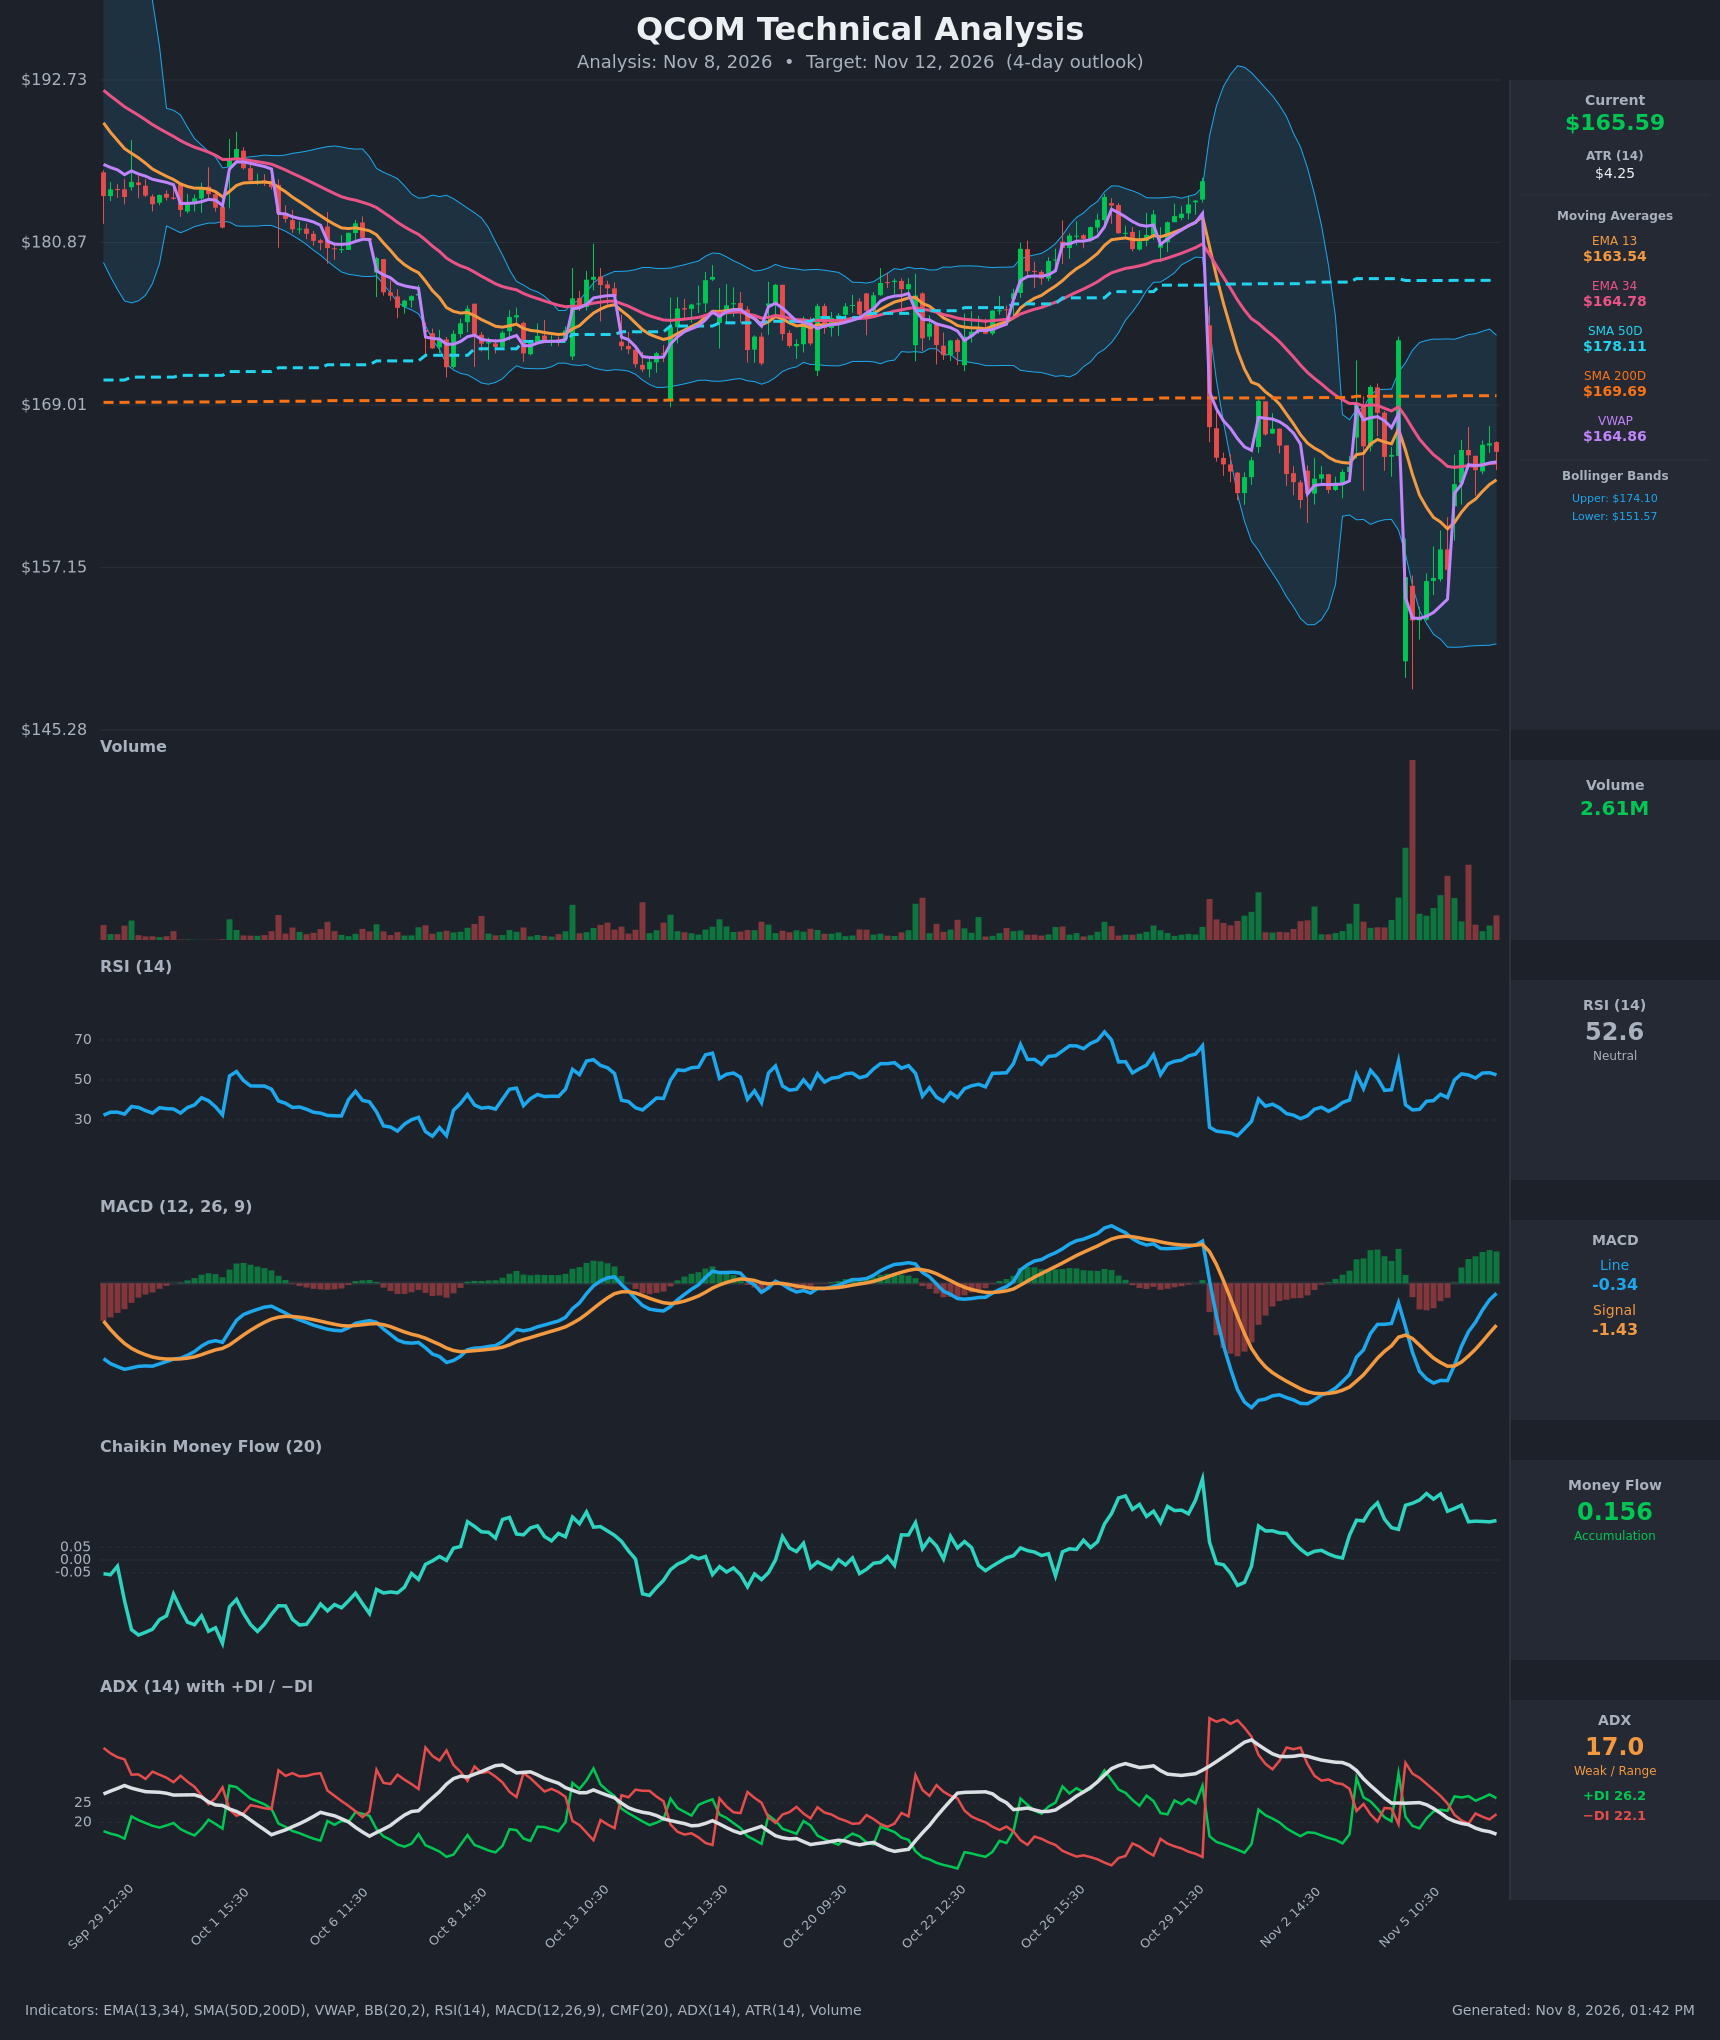
Analysis
TECHNICAL INDICATORS
- RSI (14): 52.58, neutral. It has recovered from an oversold-adjacent 35 on Nov 5 and has flattened in the low 50s over the last few bars. Momentum has stabilized but not accelerated. [Neutral]
- 20 EMA (EMA 13 / EMA 34 used): Price at $165.59 is above EMA13 ($163.54) and just above EMA34 ($164.78). EMA13 is rising but still below EMA34, so the bullish crossover has not completed. A cross is plausible within a few bars if price holds. [Bullish]
- MACD: Line -0.34 is above the signal at -1.43 after a bullish crossover on Nov 6 morning. The histogram is positive and expanding, and both lines are rising toward the zero line. This is improving momentum, though it is still below zero. [Bullish]
- Bollinger Bands (20): Upper $174.10, lower $151.57, with the midline near $162.8. Price is just above the midline, with the bands still wide from the Nov 5 gap and capitulation. The wide bands show elevated volatility, and the upper half offers about $8 of room. [Neutral]
- CMF (20): 0.156, well above +0.05 and positive throughout the selloff and rebound. Buyers were absorbing supply even on the drop, which points to accumulation. [Accumulation]
- ADX (14): 17.0 and falling, so there is no trend (weak or range-bound). +DI (26.2) is above −DI (22.1), a modest bullish tilt after bears dominated on Nov 5. [Weak Trend, slightly bullish]
- Volume: 2.61M, well below the capitulation spike on Nov 5 and fading during the rebound. The rebound is not strongly confirmed by volume, but the heavy selling volume has been absorbed. [Neutral/Mildly Bullish]
DIVERGENCES & TRENDS
- Price vs CMF: Price gapped down hard while CMF stayed positive (0.15–0.26). This is a mild bullish divergence, meaning the selloff was absorbed.
- MACD: It has made a higher low and crossed above the signal, so momentum is turning up from deeply negative territory.
- ADX: It has dropped from about 25 to 17 as the sell-off trend exhausted. The market is shifting from trend to consolidation.
- DI crossover: −DI was on top during Nov 5. +DI regained the lead on Nov 6 (26.2 vs 22.1), a bullish crossover.
- Moving averages: Price is below SMA200 ($169.69) and SMA50 ($178.11), and SMA50 is above SMA200, so there is no death cross. The longer-term structure is damaged but not broken. SMA200 is the first major overhead hurdle.
- VWAP: Price is slightly above VWAP ($164.86), so intraday control favors buyers marginally.
CHART PATTERNS
- V-shaped recovery / gap-fill attempt: After the Nov 5 gap down to about $153, price retraced roughly 60% of the drop. The prior gap zone is about $170–$173.
- Small consolidation (pennant-like): The last six hourly bars sit in a tight $164–$166 range, with price coiling above EMA13 and VWAP. This resembles a Bullish Pennant, a continuation of the rebound. The measured move is about $7–$8 from the flagpole, but the SMA200 at ~$169.69 will likely cap the first leg.
- Counter-pattern: The gap-down area and the SMA200/SMA50 stack form overhead supply. A failure here would look like a lower-high rebound within a broader downtrend, as in a bearish flag.
POTENTIAL SCENARIOS
- Scenario 1: Bullish Pennant Breakout toward SMA200 — Price holds above EMA13/VWAP, the MACD histogram keeps expanding, and CMF stays positive, pushing price into the SMA200 zone. Trigger: hourly close above $166.50 with rising volume. Target: $168.00–$169.70. Invalidation: close below $163.50 (EMA13) on strong volume. (50% probability)
- Scenario 2: Neutral Range Consolidation — With ADX at 17, price chops between EMA13 support and the $167–$169 resistance zone and ends near the current level. Trigger: failure to close above $167 and no break below $163.5. Target: $164.00–$167.00. Invalidation: a decisive break of either $163 or $170. (27% probability)
- Scenario 3: Bearish Rejection / Lower High — The rebound stalls under the SMA200 and the overhead supply and gap resistance reassert. Price loses EMA13 and VWAP and retests the gap lows. Trigger: close below $163.50 and −DI crossing back above +DI. Target: $159.00–$161.00. Invalidation: close above $169.70 (SMA200). (23% probability)
PRICE TARGETS
- Target Price: $168.00 (4-day)
- Expected Range: $162.00 to $170.00 (width $8.00, about 4.8% of current price, consistent with a 4-day horizon of about 4–5%, and wider than a 2–3 day range)
- Key Levels: Support at $163.54 (EMA13), then $160.00. Resistance at $169.69 (SMA200), then $173–$174 (gap zone and upper Bollinger Band).
OVERALL BIAS
OVERALL BIAS: BULLISH - A bullish MACD crossover with an expanding histogram, +DI back above −DI, sustained CMF accumulation, and price above EMA13 and VWAP favor a grind toward the SMA200 at ~$169.69. Weak ADX and overhead resistance limit upside conviction, so the target is modest.
This is educational analysis and not financial advice.