QCOM 6-day bullish forecast — Nov 8, 2026
- Bias: Bullish
- Timeframe: 6 days (made Nov 8, 2026, target date Nov 13, 2026)
- Price at analysis: $165.59
- Price target: $168.50
- Expected range: $161.50 – $171.50
- Result: Correct (+3.2%) — closed at $170.90 on Nov 13, 2026; quality score 100/100
Get a free AI analysis of QCOM today
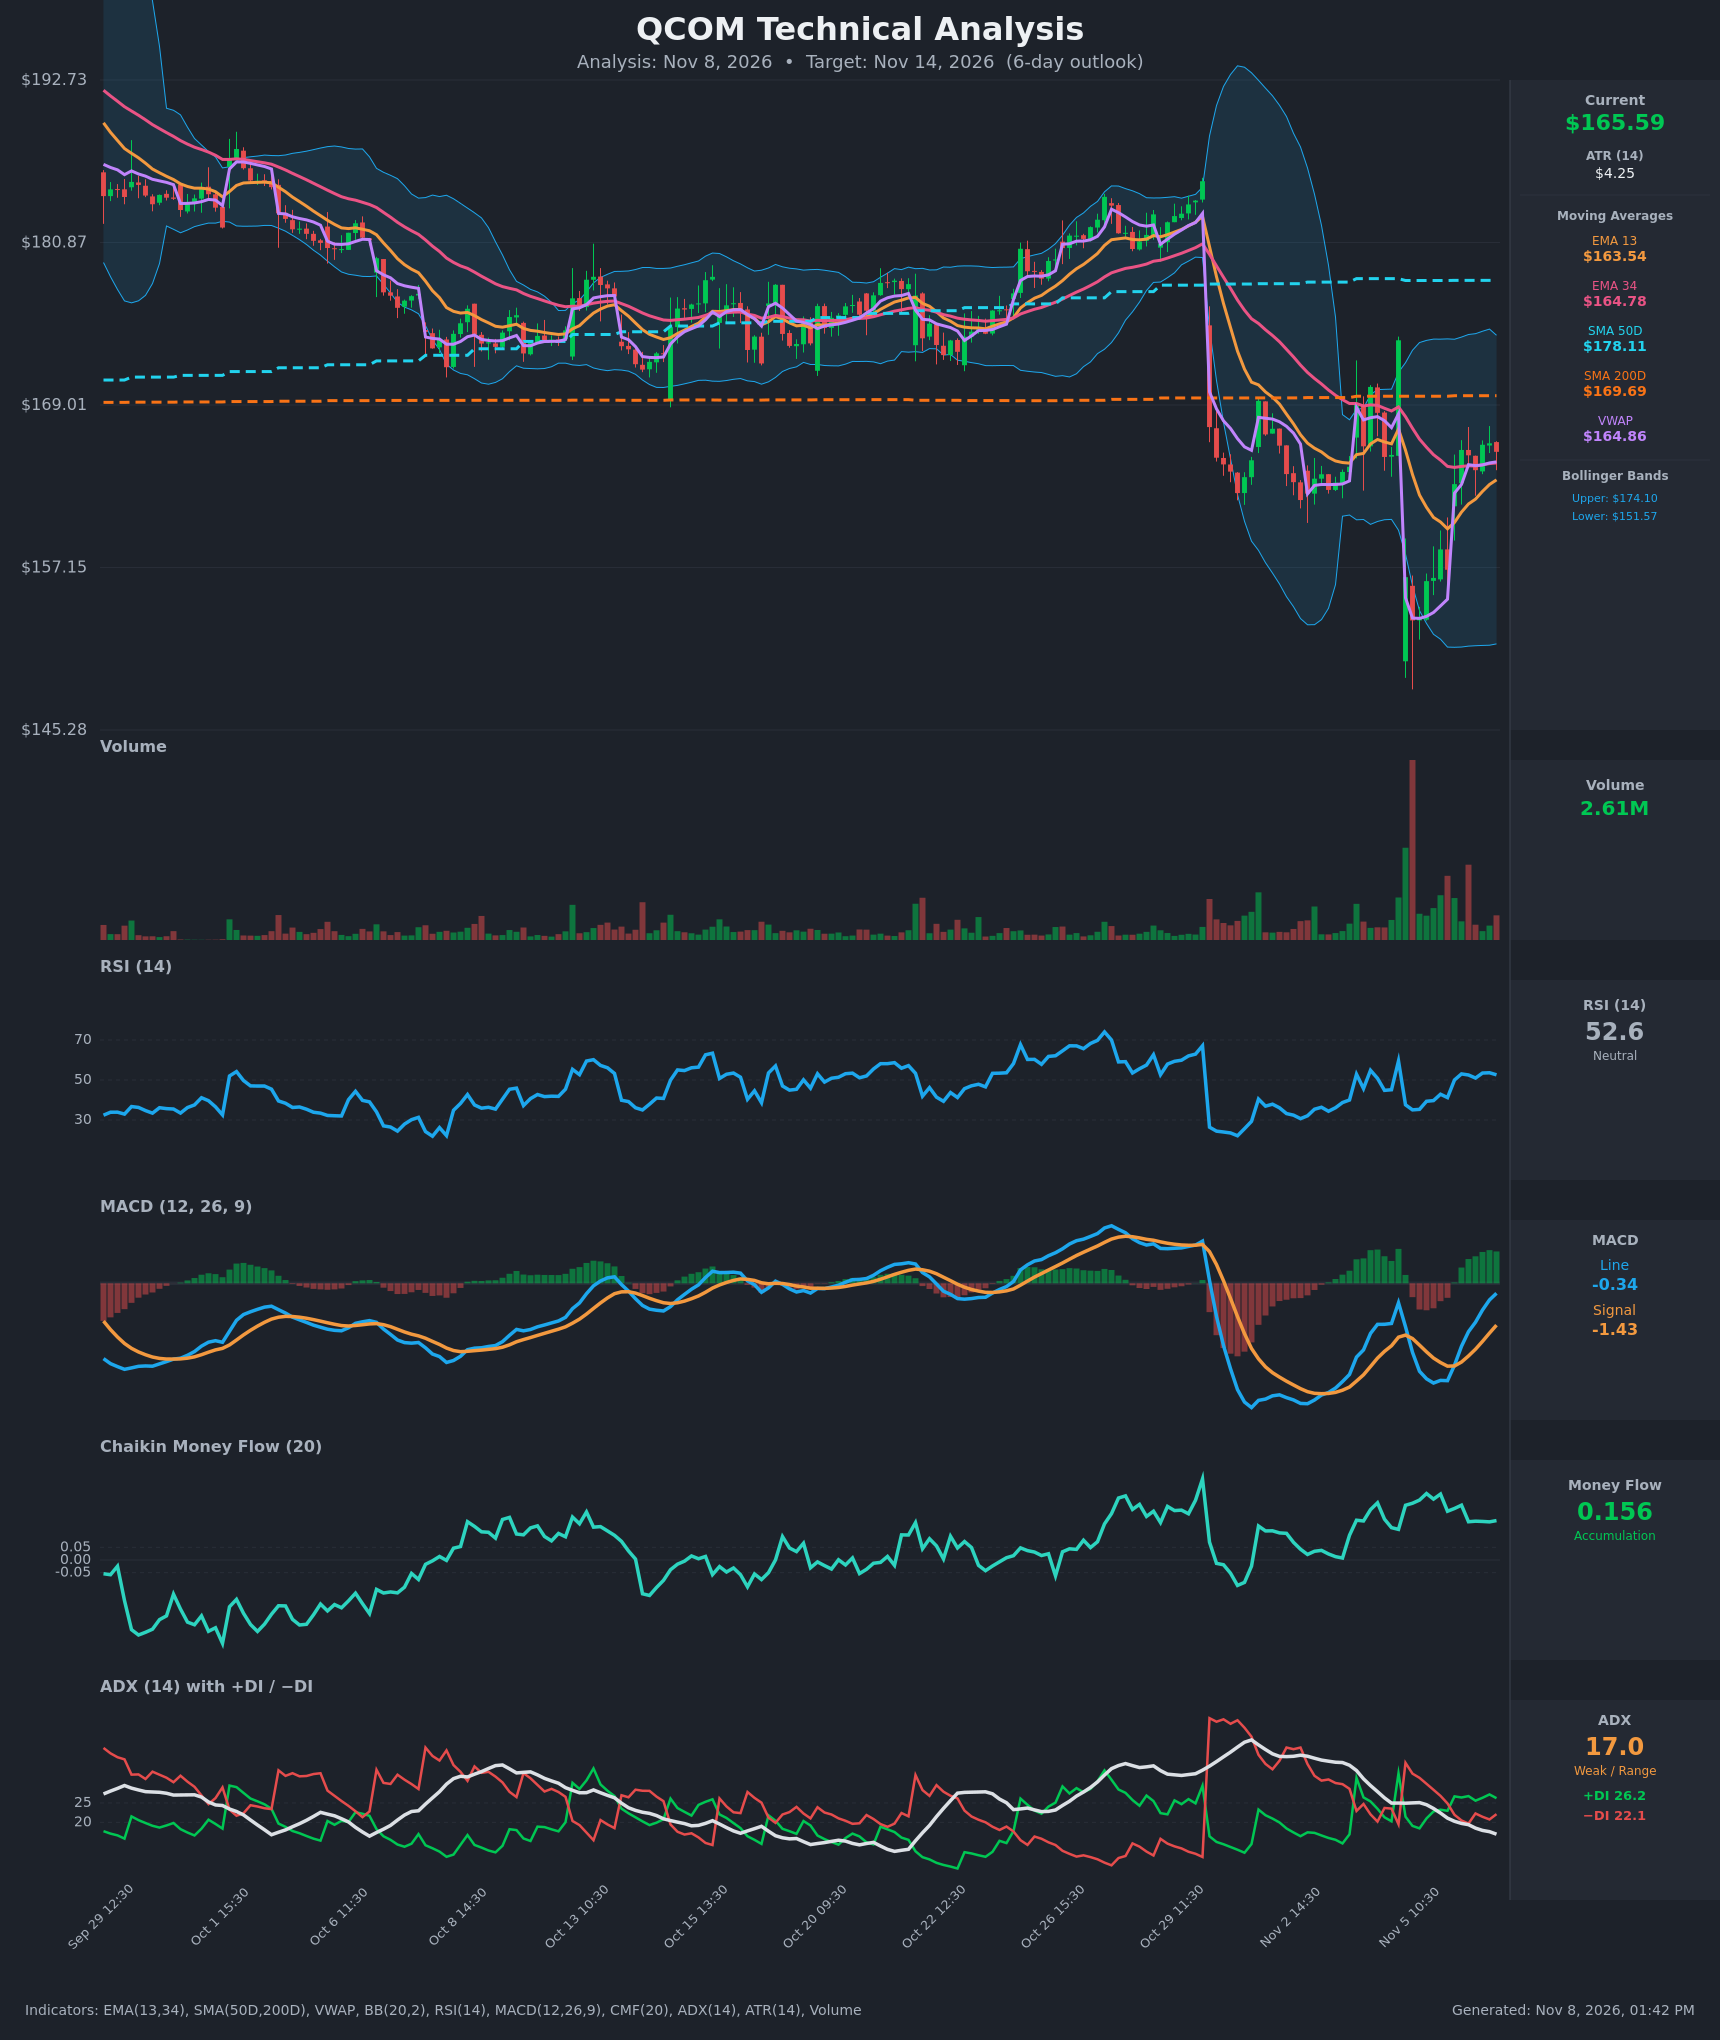
Analysis
TECHNICAL INDICATORS
- RSI (14): 52.58, neutral and recovering from the 35 low on Nov 5 after the post-earnings gap-down. It has flattened in the low 50s over the last few bars, so upside momentum is stable rather than accelerating. [Neutral]
- 20 EMA: The data provides EMA 13 at $163.54 and EMA 34 at $164.78. Price ($165.59) is above both, so they act as near-term support. EMA13 is rising sharply, but it is still below EMA34, so no bullish crossover has occurred yet. EMA13 is closing the gap with EMA34. [Bullish]
- MACD: The line (-0.34) crossed above the signal (-1.43) on Nov 6, and the histogram is positive and expanding. Both lines are still below zero, so this is a recovery rather than a confirmed new uptrend. [Bullish]
- Bollinger Bands (20): Upper $174.10, lower $151.57, with a midline near $162.8. The bands are very wide because of the gap-down volatility spike. Price is in the upper half of the band, having bounced from the lower band. The wide bands imply high volatility with room on both sides. [Neutral]
- CMF (20): 0.156, well above the +0.05 threshold. It has been positive throughout the selloff and rebound, so dip-buying and accumulation are visible. [Accumulation]
- ADX (14): 17.0, falling, which is weak and range-bound. +DI (26.2) is above −DI (22.1), a modest bullish tilt after the DI crossover on Nov 6. Trend strength is low, so follow-through is not guaranteed. [Weak Trend, bullish tilt]
- Volume: 2.61M on the latest bar, well below the huge Nov 5 gap-down spike. Volume on the rebound bars is mostly green but moderate. Selling pressure has faded, though the rebound lacks a strong volume surge. [Mildly Bullish, fading selling pressure]
DIVERGENCES & TRENDS
- CMF stayed positive (0.15–0.26) through the sharp price drop, showing accumulation on the dip rather than distribution. This is a mild bullish divergence.
- RSI and MACD have made higher lows since Nov 5, in line with the price recovery from about $153 to $165.6.
- MACD bullish crossover on Nov 6, and +DI crossed back above −DI.
- Price reclaimed VWAP ($164.86) and both EMAs, but remains below the SMA200 ($169.69) and well below the SMA50 ($178.11).
- The SMA50 is above the SMA200, so there is no death cross, but the gap between them is widening. Price below both leaves the longer-term structure damaged.
- ADX is falling toward 17, indicating the volatile move is ending and a consolidation is likely.
CHART PATTERNS
- Gap-down and V-shaped recovery: The post-earnings drop from about $173 to about $153 was followed by a rebound that retraced roughly 60% of the gap. This is a classic gap-and-retrace setup.
- Bullish Double Bottom (loose): Lows on Nov 5 and Nov 6 were around $153 and $156–157, with a neckline near $166. Price is now testing the neckline. A clean break above $166.5–$167 would target about $169.7–$173, near the SMA200 and the gap origin.
- Overhead resistance is stacked at the SMA200 ($169.69) and the gap origin (about $173.7). These limit upside within 6 days.
POTENTIAL SCENARIOS
- Scenario 1: Bullish Grind Toward SMA200 — Positive MACD crossover, CMF accumulation and reclaimed EMAs and VWAP support continued recovery toward the SMA200. Trigger: close above $166.50 with volume above 2.5M. Target: $168.50–$170. Invalidation: close below $162.50. (50% probability)
- Scenario 2: Neutral Consolidation — Weak ADX and overhead resistance keep price pinned between the EMAs and the SMA200. Trigger: failure to break $167 and hold above $163.5. Target: $163.50–$167. Invalidation: close outside either end of that range. (25% probability)
- Scenario 3: Bearish Rejection at Resistance — The rebound stalls at $167–$170 (SMA200), the EMAs fail, and price re-tests the post-gap lows. Trigger: close below $163.50 (EMA13) and VWAP. Target: $158–$160. Invalidation: close above $170. (25% probability)
PRICE TARGETS
- Target Price: $168.50 (6-day)
- Expected Range: $161.50 to $171.50 (width $10.00, about 6.0% of current price, consistent with a 6-day horizon)
- Key Levels: Support at $163.54 (EMA13), Resistance at $169.69 (SMA200)
OVERALL BIAS
OVERALL BIAS: BULLISH - MACD has crossed bullishly, CMF shows strong accumulation (0.156), and price has reclaimed VWAP and both EMAs with +DI above −DI. Upside is likely capped near the SMA200 at about $169.7, and weak ADX (17) limits conviction.
This is educational analysis and not financial advice.