BB 13-day bullish forecast — Nov 8, 2026
- Bias: Bullish
- Timeframe: 13 days (made Nov 8, 2026, target date Nov 20, 2026)
- Price at analysis: $8.72
- Price target: $8.95
- Expected range: $8.25 – $9.25
- Result: Pending — graded after the close on Nov 20, 2026
Get a free AI analysis of BB today
Analysis
TECHNICAL INDICATORS
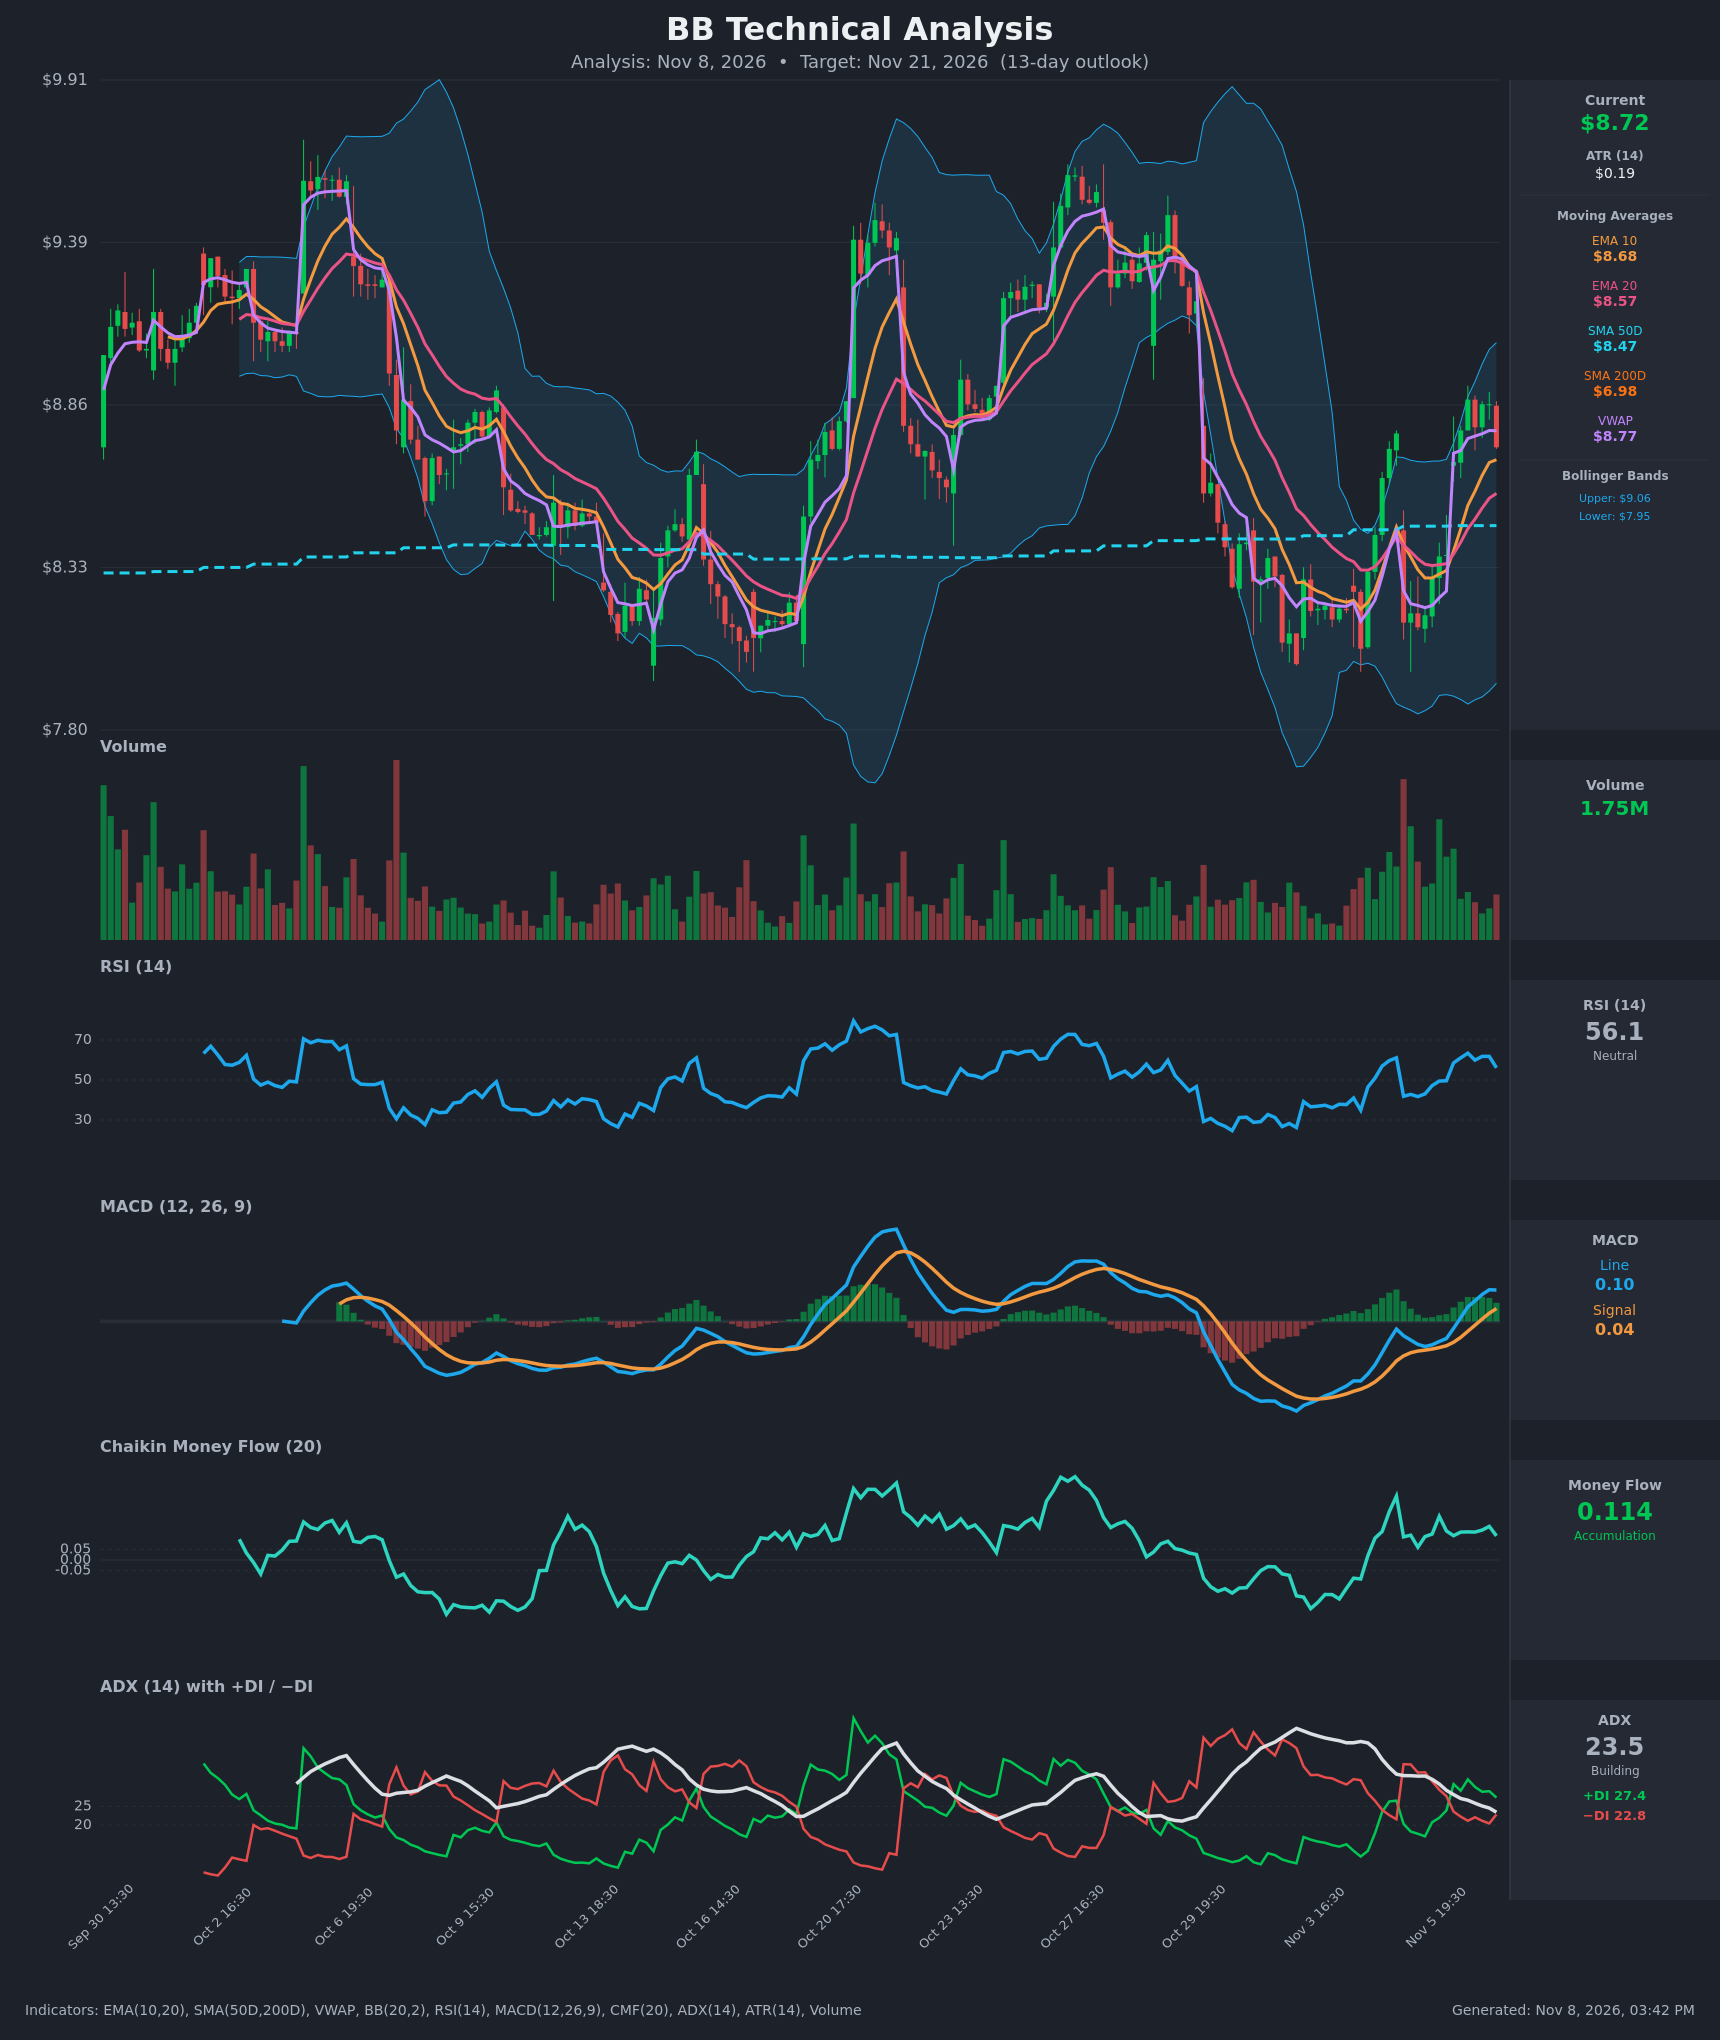
- RSI (14): 56.10, down from 61.8 on the previous bar. It is above the 50 midline but off its recent high, so momentum is cooling slightly without being overbought. [Neutral]
- 20 EMA: $8.5702, with price at $8.72 above it. EMA10 ($8.68) is above EMA20 and the EMAs are rising, so the short-term trend structure is bullish. Price is only $0.04 above EMA10, so the $8.57–$8.68 zone is the first support. [Bullish]
- MACD: Line 0.0992 is above signal 0.0406, with a positive histogram of about 0.058. The bullish crossover happened on Nov 6. The line has flattened (0.100 to 0.099), so momentum is plateauing. [Bullish]
- Bollinger Bands (20): Upper $9.0605, lower $7.9527, midline about $8.51. Price at $8.72 is in the upper half, roughly 69% of the band width, and the bands are fairly wide. The upper band is about $0.34 above, so there is room to run but not much edge. [Neutral]
- CMF (20): 0.114 is above +0.05 and has been positive through the recent bars, which indicates sustained accumulation. [Accumulation]
- ADX (14): 23.5 and falling from 33.6, so the trend is moderate and fading. +DI at 27.4 is above −DI at 22.8, so bulls are in control, but the spread is narrow. [Weak/Moderate Trend, Bullish lean]
- Volume: 1.75M, about average. The volume spikes were on the Nov 5 selloff and the Nov 6 rally. The latest red candle came on modest volume, so the pullback shows no heavy distribution. [Neutral to mildly supportive]
Other levels:
- Price is below VWAP ($8.77), which is a minor short-term headwind.
- Price is far above the SMA200D ($6.98), a long-term uptrend.
- SMA50D is at $8.47, and the 50D has been above the 200D, so there is no death cross.
DIVERGENCES & TRENDS
- There is no clear price/RSI divergence. RSI fell from 63.4 to 56.1 while price pulled back from $8.88 to $8.72, which is consistent rather than divergent.
- MACD crossed bullish on Nov 6, and the histogram is positive but flattening, an early sign of momentum stalling.
- ADX has dropped from 33.6 to 23.5, so the Nov 5 bearish impulse has faded. The +DI/−DI crossover back to bulls on Nov 6 shows control shifting up.
- The EMA10 > EMA20 > SMA50D alignment is bullish.
- Price has been oscillating in a roughly $8.00–$9.50 range for weeks, with sharp V-shaped swings. A higher low formed around $8.00–$8.10 in early November versus the mid-October low.
- The latest candle is red and sits just under VWAP, hinting at short-term hesitation.
CHART PATTERNS
- The pattern is closest to a Bullish Triple/Double Bottom structure. The lows in the $7.95–$8.10 area (mid-October and early November) held, and price is moving up from that base.
- It also resembles a broad range with higher-low tendencies. The measured move from the base is a retest of the $9.30–$9.50 prior highs, with a breakout above that area needed to confirm.
- There is no decisive breakout yet. The $9.00–$9.10 zone (upper Bollinger Band and prior swing region) is the first hurdle.
POTENTIAL SCENARIOS
- Scenario 1: Bullish Continuation Toward Range Highs — Price holds above the EMA10/EMA20 and the MACD stays positive with CMF accumulation. It reclaims VWAP and pushes toward the upper Bollinger Band. Trigger: close above $8.80 to $8.88. Target: $9.05 to $9.30. Invalidation: close below $8.45 (under EMA20 and SMA50D). (50% probability)
- Scenario 2: Neutral Range Chop — ADX is fading, so price oscillates between EMA20 and the upper band. Trigger: failure to clear $8.90 while support at $8.55 holds. Target: $8.50 to $8.90. Invalidation: a close above $9.05 or below $8.40. (30% probability)
- Scenario 3: Bearish Pullback to Support — Momentum stalls under VWAP and the MACD histogram turns negative, leading to a retest of the SMA50D and the lower range. Trigger: close below $8.55. Target: $8.20 to $8.30. Invalidation: reclaim of $8.85. (20% probability)
PRICE TARGETS
For the 13-day horizon, the range width should be about 8–12% of price (roughly $0.70 to $1.05). Using $1.00 gives an expected range of $8.25 to $9.25, a width of about 11.5%. That is also consistent with the ATR of $0.19, since 13 days at roughly $0.19 per day with square-root scaling gives about ±$0.70.
- Target Price: $8.95 (for 13 days)
- Expected Range: $8.25 to $9.25
- Key Levels: Support at $8.57, Resistance at $9.06
OVERALL BIAS
OVERALL BIAS: BULLISH - The MACD has crossed bullish, EMA10 is above EMA20, +DI leads −DI, CMF shows accumulation, and price sits well above the rising SMA50D and SMA200D, with room to the $9.06 upper band. The fading ADX and the position under VWAP limit conviction.
This is educational analysis and not financial advice.