IWM 13-day bearish forecast — Nov 8, 2026
- Bias: Bearish
- Timeframe: 13 days (made Nov 8, 2026, target date Nov 20, 2026)
- Price at analysis: $273.64
- Price target: $270.50
- Expected range: $259.50 – $281.00
- Result: Pending — graded after the close on Nov 20, 2026
Get a free AI analysis of IWM today
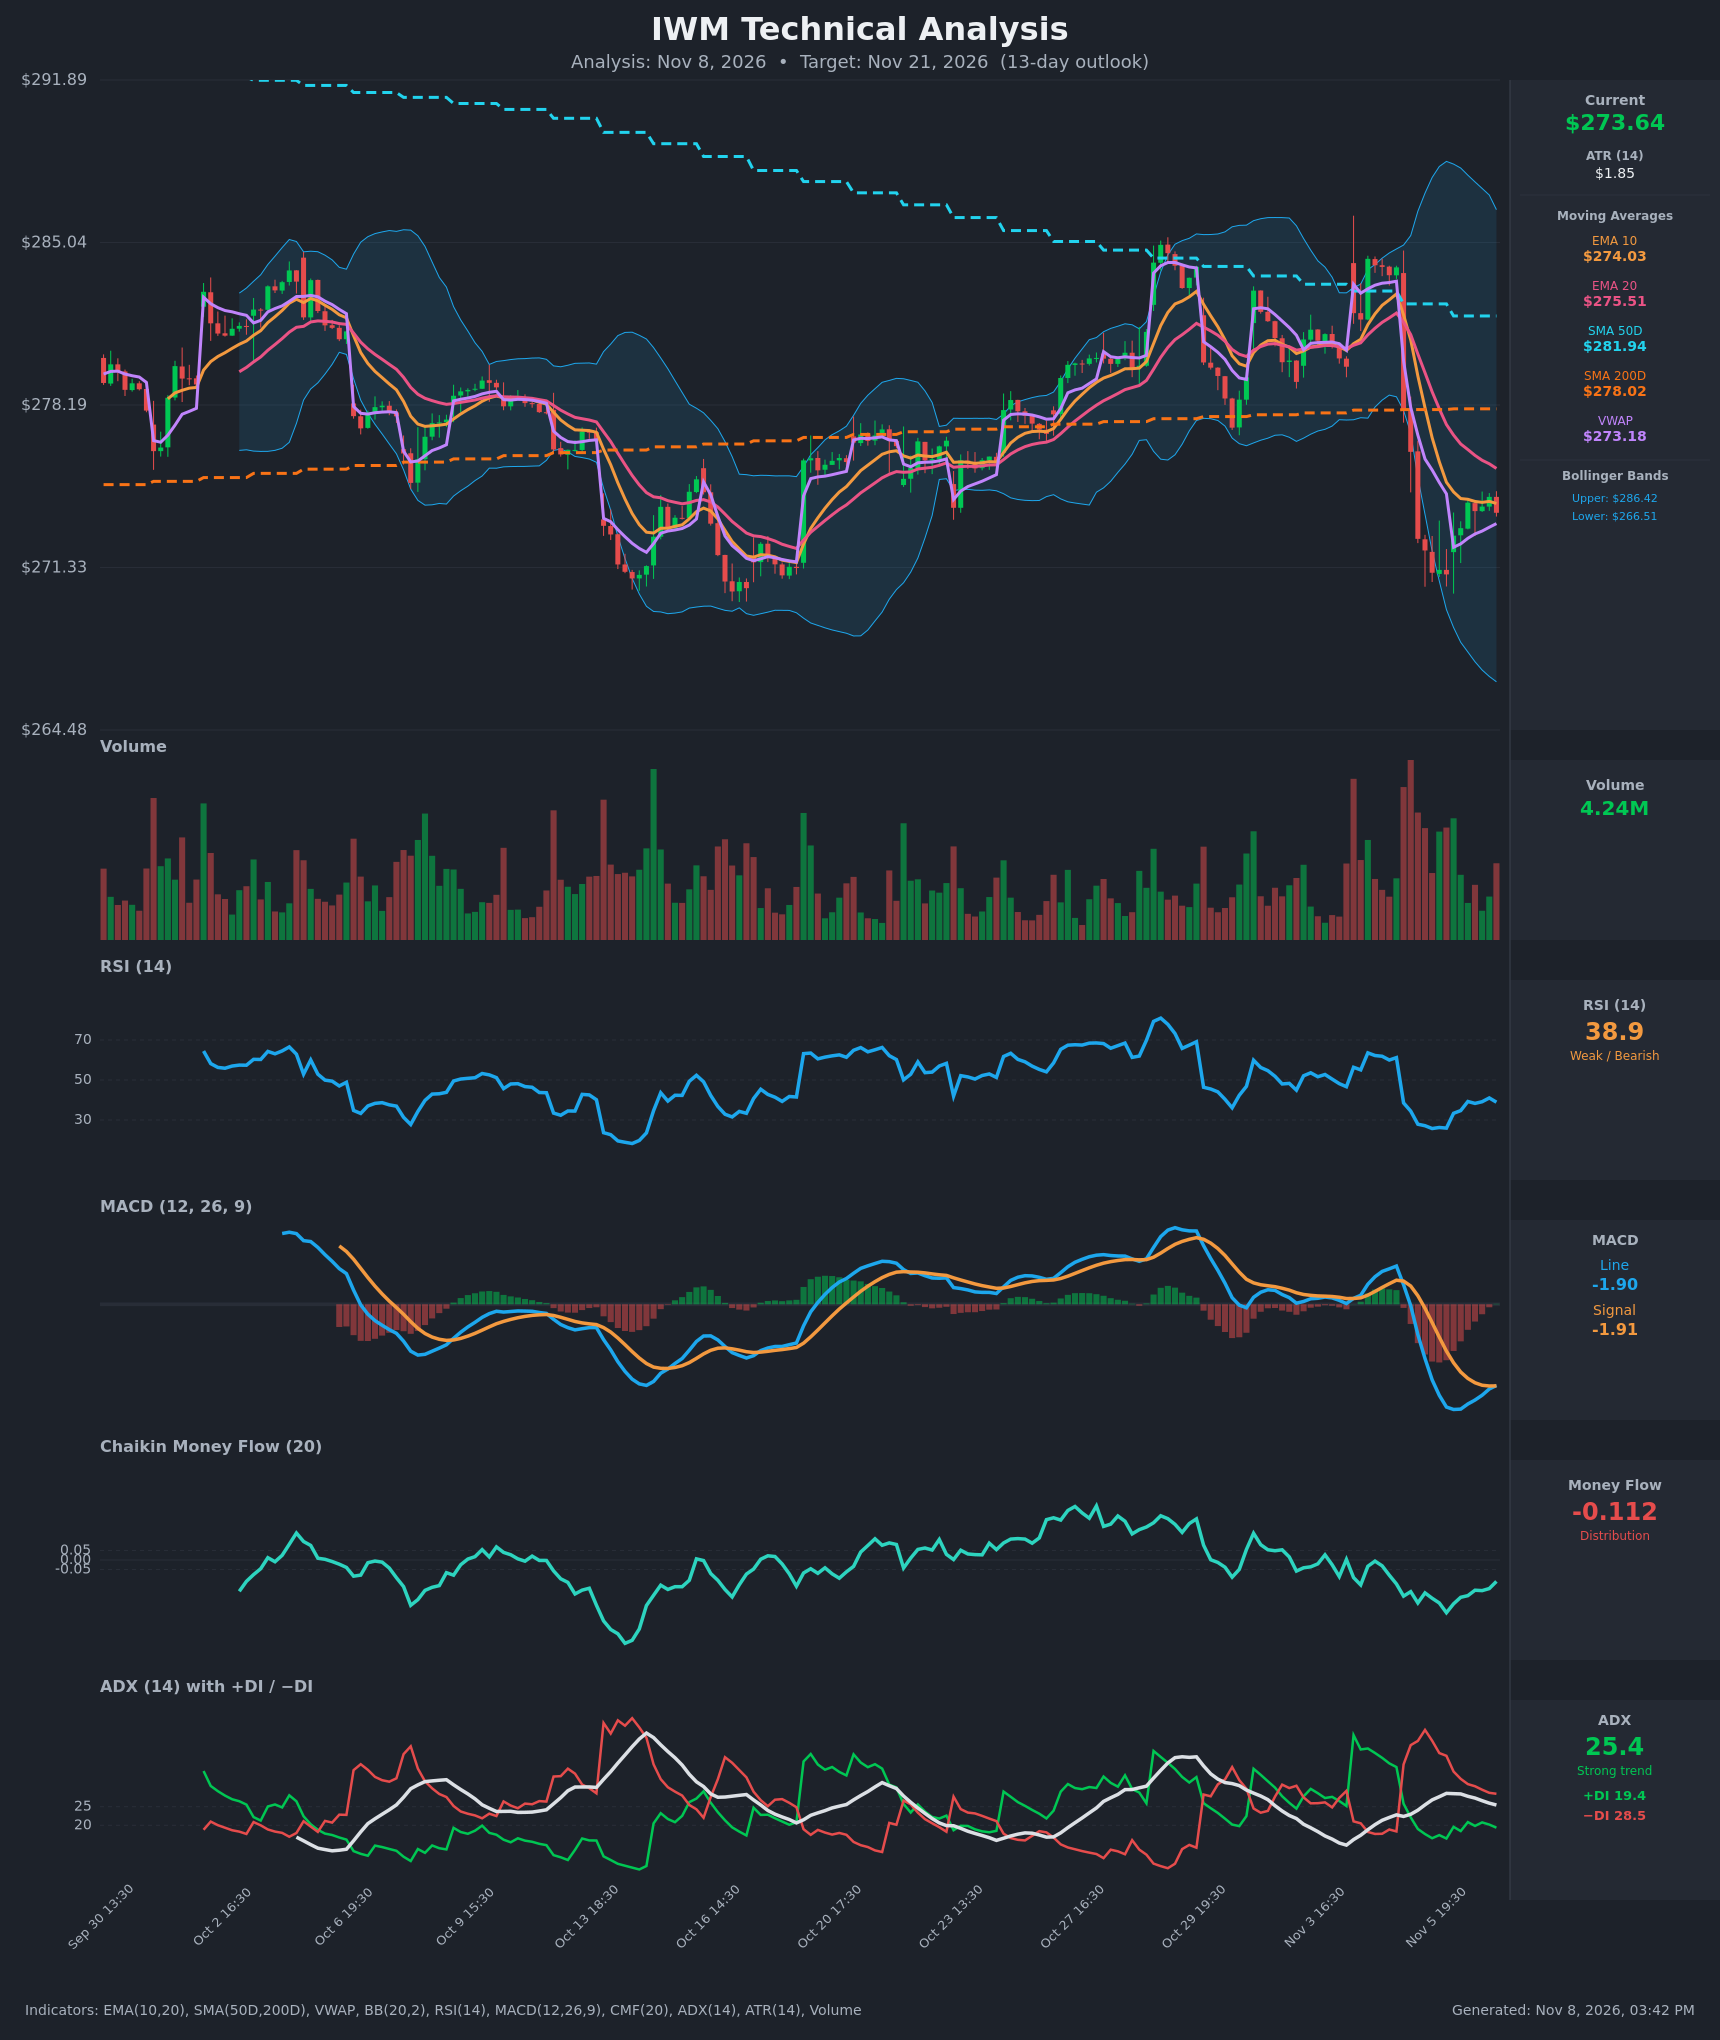
Analysis
TECHNICAL INDICATORS
- RSI (14): 38.91, recovering from an oversold low near 25.7 on Nov 5 but still under 50. Momentum has bounced off the lows without regaining the midline. [Bearish]
- 20 EMA: $275.51, with price at $273.64 below it. The EMA10 ($274.03) is also above price, and both are sloping down. EMA10 crossed below EMA20 on Nov 5 and remains below. The 20 EMA is overhead resistance. [Bearish]
- MACD: Line -1.90 vs signal -1.91, so the line is essentially at the signal after a deep dip to about -2.47. The line has turned up and is now marginally above the signal, a nascent bullish crossover. Both lines are still well below zero. [Neutral]
- Bollinger Bands (20): Upper $286.42, lower $266.51, midline about $276.5. Price sits in the lower half, between the lower band and the midline, after the sharp drop that nearly tagged the lower band. The bands are wide after the volatility spike. [Bearish]
- CMF (20): -0.112, below the -0.05 threshold. It has been negative for several sessions, with a slight uptick from -0.276. Selling pressure persists. [Distribution]
- ADX (14): 25.4, with -DI at 28.5 above +DI at 19.4. ADX is now declining from 28.6 and -DI is falling, so the trend is strong but losing steam. Bears still control. [Strong Trend - Bearish, fading]
- Volume: 4.24M, with heavy volume on the Nov 4–5 selloff and lighter volume on the recent bounce. The weak bounce suggests a lack of conviction from buyers. [Bearish-leaning]
DIVERGENCES & TRENDS
- Price has made a flat-to-slightly-higher low (about $271 on Nov 5, with Nov 6 consolidating at $272-274). RSI has also risen from 25.7 to 39, which is momentum stabilization rather than a clean bullish divergence.
- MACD has flattened and nearly crossed up while still deeply negative. This points to selling exhaustion, not a trend reversal.
- Price is below EMA10, EMA20, SMA50D ($281.94) and SMA200D ($278.02). The price breakdown below the SMA200D is a notable long-term bearish shift. SMA50D remains above SMA200D, so there is no death cross yet.
- Price is above VWAP ($273.18) by a small margin, which is a minor intraday positive.
- ADX is falling from 28.6 to 25.4, and -DI is shrinking. Downside momentum is cooling, which favors a consolidation or a relief bounce.
- The chart shows a gap-like drop from about $284 to $272 in a single session, followed by a basing range of $271–$274.5.
CHART PATTERNS
- Bearish Pennant / Flag (continuation): After the sharp drop from $284 to $271, price is forming a small tight consolidation of $271–$274.5. A break below $271 would project a measured move of roughly $12, to around $259–$262. That target is likely too aggressive for 13 days, so it is a tail scenario.
- Possible small base (short-term): The higher low and the RSI recovery suggest a relief bounce toward the EMA20 and the midline of the bands, around $275.5–$277.
- Price is stuck below the former support, SMA200D (about $278), which has flipped to resistance, and the October range lows near $271 act as support.
POTENTIAL SCENARIOS
- Scenario 1: Bearish Pennant Breakdown / Continuation Lower — The bounce stalls beneath the EMA20 and SMA200D resistance, and sellers resume with -DI above +DI and CMF in distribution. Trigger: Close below $271 (the Nov 5 low zone). Target: $266.50 (lower Bollinger Band), then possibly $263. Invalidation: Daily close above $278 (SMA200D). (45% probability)
- Scenario 2: Bullish Relief Bounce — The MACD crossover and the recovery from oversold RSI lead to a mean-reversion bounce toward the EMA20/midline and the SMA200D. Trigger: Break above $275.5 (EMA20) on rising volume. Target: $277–$278.5. Invalidation: Close below $271. (35% probability)
- Scenario 3: Neutral Range-Bound Chop — Price oscillates between $271 and $276 as ADX fades. Trigger: Failure to break either $271 or $276. Target: $272–$275. Invalidation: Decisive break of either boundary. (20% probability)
PRICE TARGETS
For the 13-day horizon (to Nov 21), a ~8-12% wide range is appropriate. The bias leans bearish because price is below all major moving averages, CMF is in distribution, -DI is above +DI, and the bounce has come on light volume. The target is modestly below the current price.
- Target Price: $270.50
- Expected Range: $259.50 to $281.00 (width $21.50, about 7.9% of the current price; ~1.8x ATR-scaled 13-day swing, within the 14-21 day guidance floor given the trending, volatile backdrop)
- Key Levels: Support at $271.00 (recent swing low), Resistance at $275.51 (20 EMA), with major resistance at $278.02 (SMA200D)
OVERALL BIAS
OVERALL BIAS: BEARISH - Price is below the EMA10/EMA20, SMA50D and SMA200D, -DI leads +DI with ADX above 25, CMF shows distribution, and the bounce has come on weak volume. The nearly flat MACD and the oversold RSI recovery argue for a possible relief bounce first, but sellers are likely to defend the $275–$278 resistance zone.
This is educational analysis and not financial advice.