QCOM 13-day bullish forecast — Nov 8, 2026
- Bias: Bullish
- Timeframe: 13 days (made Nov 8, 2026, target date Nov 20, 2026)
- Price at analysis: $165.59
- Price target: $169.50
- Expected range: $158.50 – $175.00
- Result: Pending — graded after the close on Nov 20, 2026
Get a free AI analysis of QCOM today
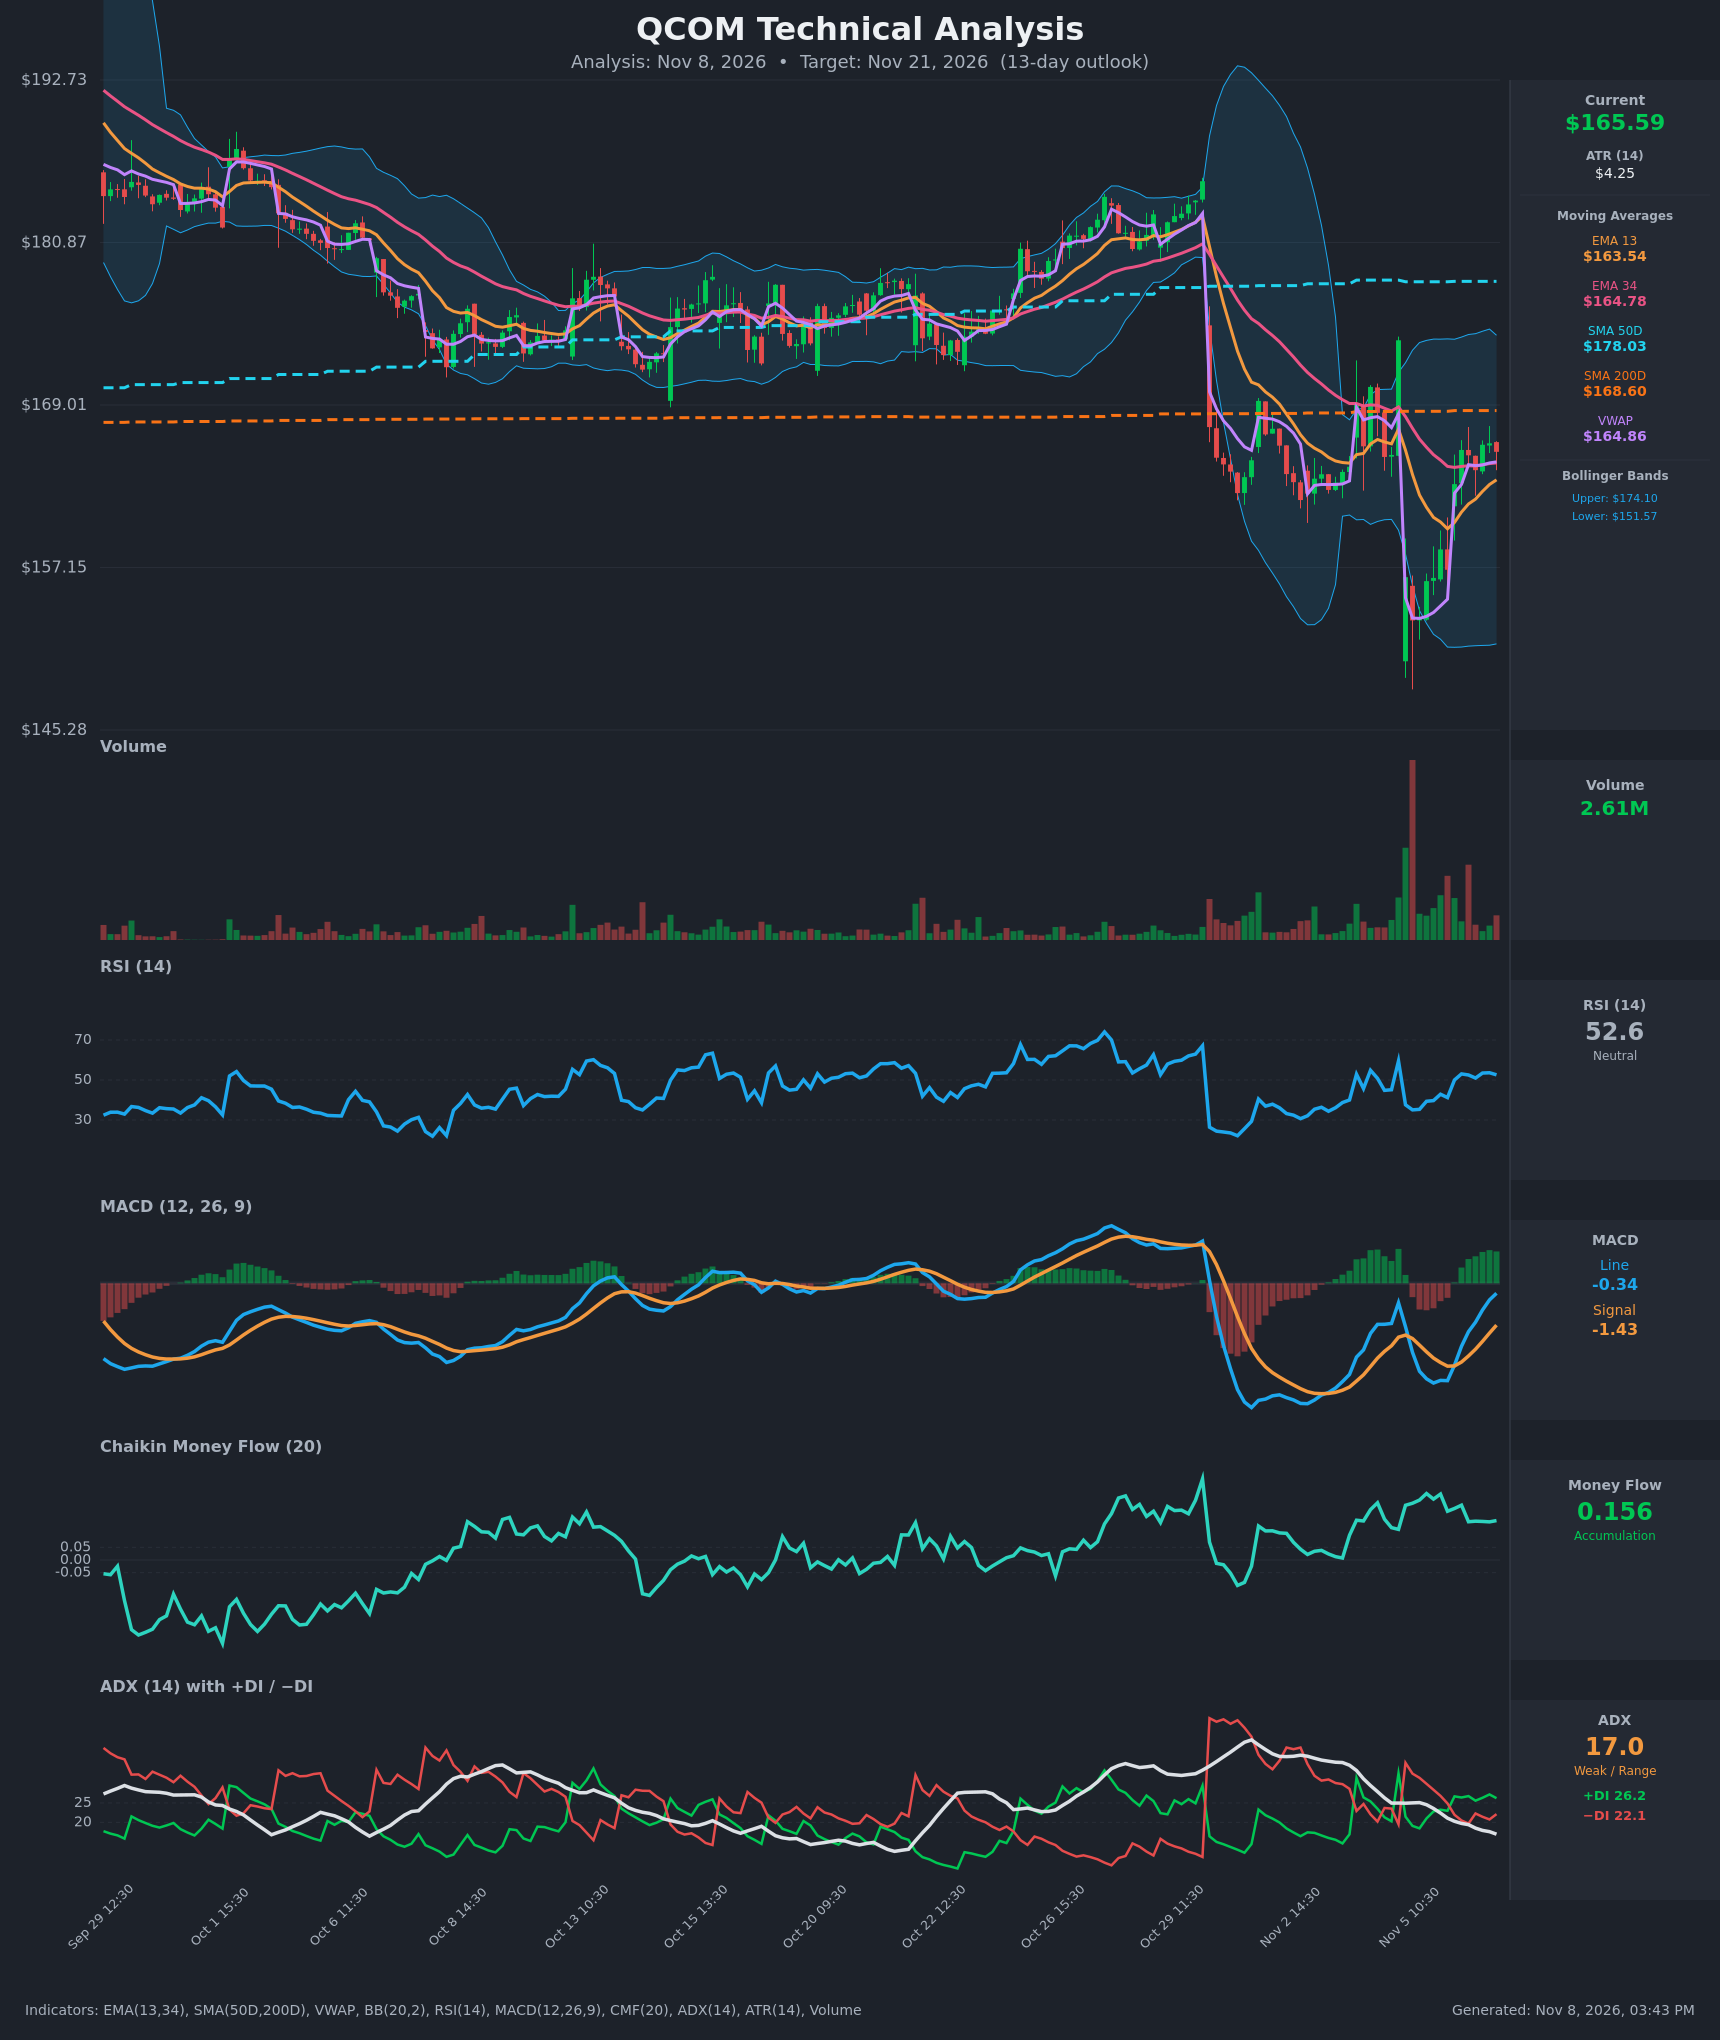
Analysis
TECHNICAL INDICATORS
- RSI (14): 52.58, back at the midline after a plunge to ~35 on Nov 5. It has recovered steadily from the oversold-leaning zone, with momentum rising and no overbought risk. [Bullish]
- 20 EMA: The data provides EMA 13 ($163.54) and EMA 34 ($164.78). Price at $165.59 is above both, so they act as support. EMA13 is rising sharply, but EMA13 is still below EMA34, so no bullish EMA crossover yet. A crossover looks close if price holds. [Bullish]
- MACD: Line -0.34, signal -1.43, histogram positive (~+1.09) and expanding. The bullish crossover happened around Nov 6 09:30-10:30. Both lines are still below zero, so this is a recovery rather than a confirmed new uptrend. [Bullish]
- Bollinger Bands (20): Upper $174.10, lower $151.57, midline ~$162.8. Price is above the midline in the upper half of the band. The bands are very wide from the Nov 5 gap-down volatility, so they should contract. Resistance sits near the upper band, close to the pre-gap level (~$173). [Bullish]
- CMF (20): 0.156, well above +0.05. It has stayed positive throughout the selloff and rebound, which points to dip buying and accumulation. [Accumulation]
- ADX (14): 17.0 and falling, so there is no meaningful trend and the market is range-bound. +DI (26.2) is above −DI (22.1), a slight bullish tilt after the DI flip on Nov 6. [Weak Trend + mild bullish lean]
- Volume: 2.61M on the latest bar, far below the huge capitulation spike on Nov 5. The selling climax is behind us, and recent green bars have slightly more participation than red. The rebound is not yet backed by heavy volume. [Neutral to mildly bullish]
DIVERGENCES & TRENDS
- Price made a sharp low on Nov 5 (~$153) while CMF stayed positive. That is a bullish divergence in money flow, with accumulation during the washout.
- MACD and RSI have turned up with price. MACD crossed above its signal line (bullish), and RSI has recovered from ~35 to 52.6.
- Price reclaimed VWAP ($164.86) and EMA34, a short-term trend-recovery signal.
- Price is still below SMA200 ($168.60) and well below SMA50 ($178.03). The longer-term structure is damaged and has not yet been repaired.
- SMA50 is still above SMA200, so there is no death cross, but the gap between them is narrowing slowly.
- ADX is fading toward 17, so the rebound lacks trend strength. A move to ~$168-170 is likely to meet resistance.
CHART PATTERNS
- There is no clean textbook pattern. The structure is a V-shaped recovery after a gap-down. The Nov 5 low (~$153) has been followed by a higher-low sequence, similar in spirit to a Bullish Double Bottom or base.
- The closest reference-diagram analogue is a loose Bullish Flag/Pennant-style consolidation under the SMA200. A close above ~$168.60 would confirm the recovery.
- The measured recovery target is the gap-fill zone near $173-174 (the Nov 4 close of $173.73 and the upper Bollinger Band). Failure at $168.60 would instead resemble a range with the Nov 5 gap acting as overhead supply.
POTENTIAL SCENARIOS
- Scenario 1: Bullish Recovery Toward the SMA200 and Gap Fill — Accumulation (CMF) and the MACD crossover carry price through the SMA200, and the EMA13/EMA34 bullish crossover follows. Trigger: a close above $168.60 (SMA200) on rising volume. Target: $170-174 (gap fill and upper Bollinger Band). Invalidation: a close below $163.50 (EMA13) and then VWAP/EMA34 near $164.8. (50% probability)
- Scenario 2: Neutral Range Under the SMA200 — With ADX at 17, price chops between EMA support (~$163.5) and SMA200 resistance (~$168.6). Trigger: repeated rejection at $168-169 with no volume expansion. Target: $162-168. Invalidation: a decisive break above $169 or below $162. (28% probability)
- Scenario 3: Bearish Rejection and Retest of the Lows — The rebound stalls at the SMA200 and the SMA50 slope keeps pressure on price. Sellers push it back below the EMAs. Trigger: a close below $163.50 with expanding volume. Target: $157-153 (the Nov 5 low zone). Invalidation: a reclaim of $166.50 and a close above $168.60. (22% probability)
PRICE TARGETS
Range width check: $175.00 − $158.50 = $16.50, which is 9.96% of $165.59. This fits the ~8-12% guidance for a 14-21 day horizon, and 13 days is at the low end of that band.
- Target Price: $169.50 (13-day horizon)
- Expected Range: $158.50 to $175.00
- Key Levels: Support at $163.50, Resistance at $168.60
OVERALL BIAS
OVERALL BIAS: BULLISH - The MACD bullish crossover, RSI recovery to 52.6, +DI above −DI, positive CMF (0.156) and price above EMA13/EMA34/VWAP favor a continued rebound after the capitulation selloff. The SMA200 ($168.60) is the key hurdle, and weak ADX (17) keeps conviction modest.
This is educational analysis and not financial advice.