SMCI 13-day bearish forecast — Nov 8, 2026
- Bias: Bearish
- Timeframe: 13 days (made Nov 8, 2026, target date Nov 20, 2026)
- Price at analysis: $28.76
- Price target: $27.40
- Expected range: $26.00 – $29.00
- Result: Pending — graded after the close on Nov 20, 2026
Get a free AI analysis of SMCI today
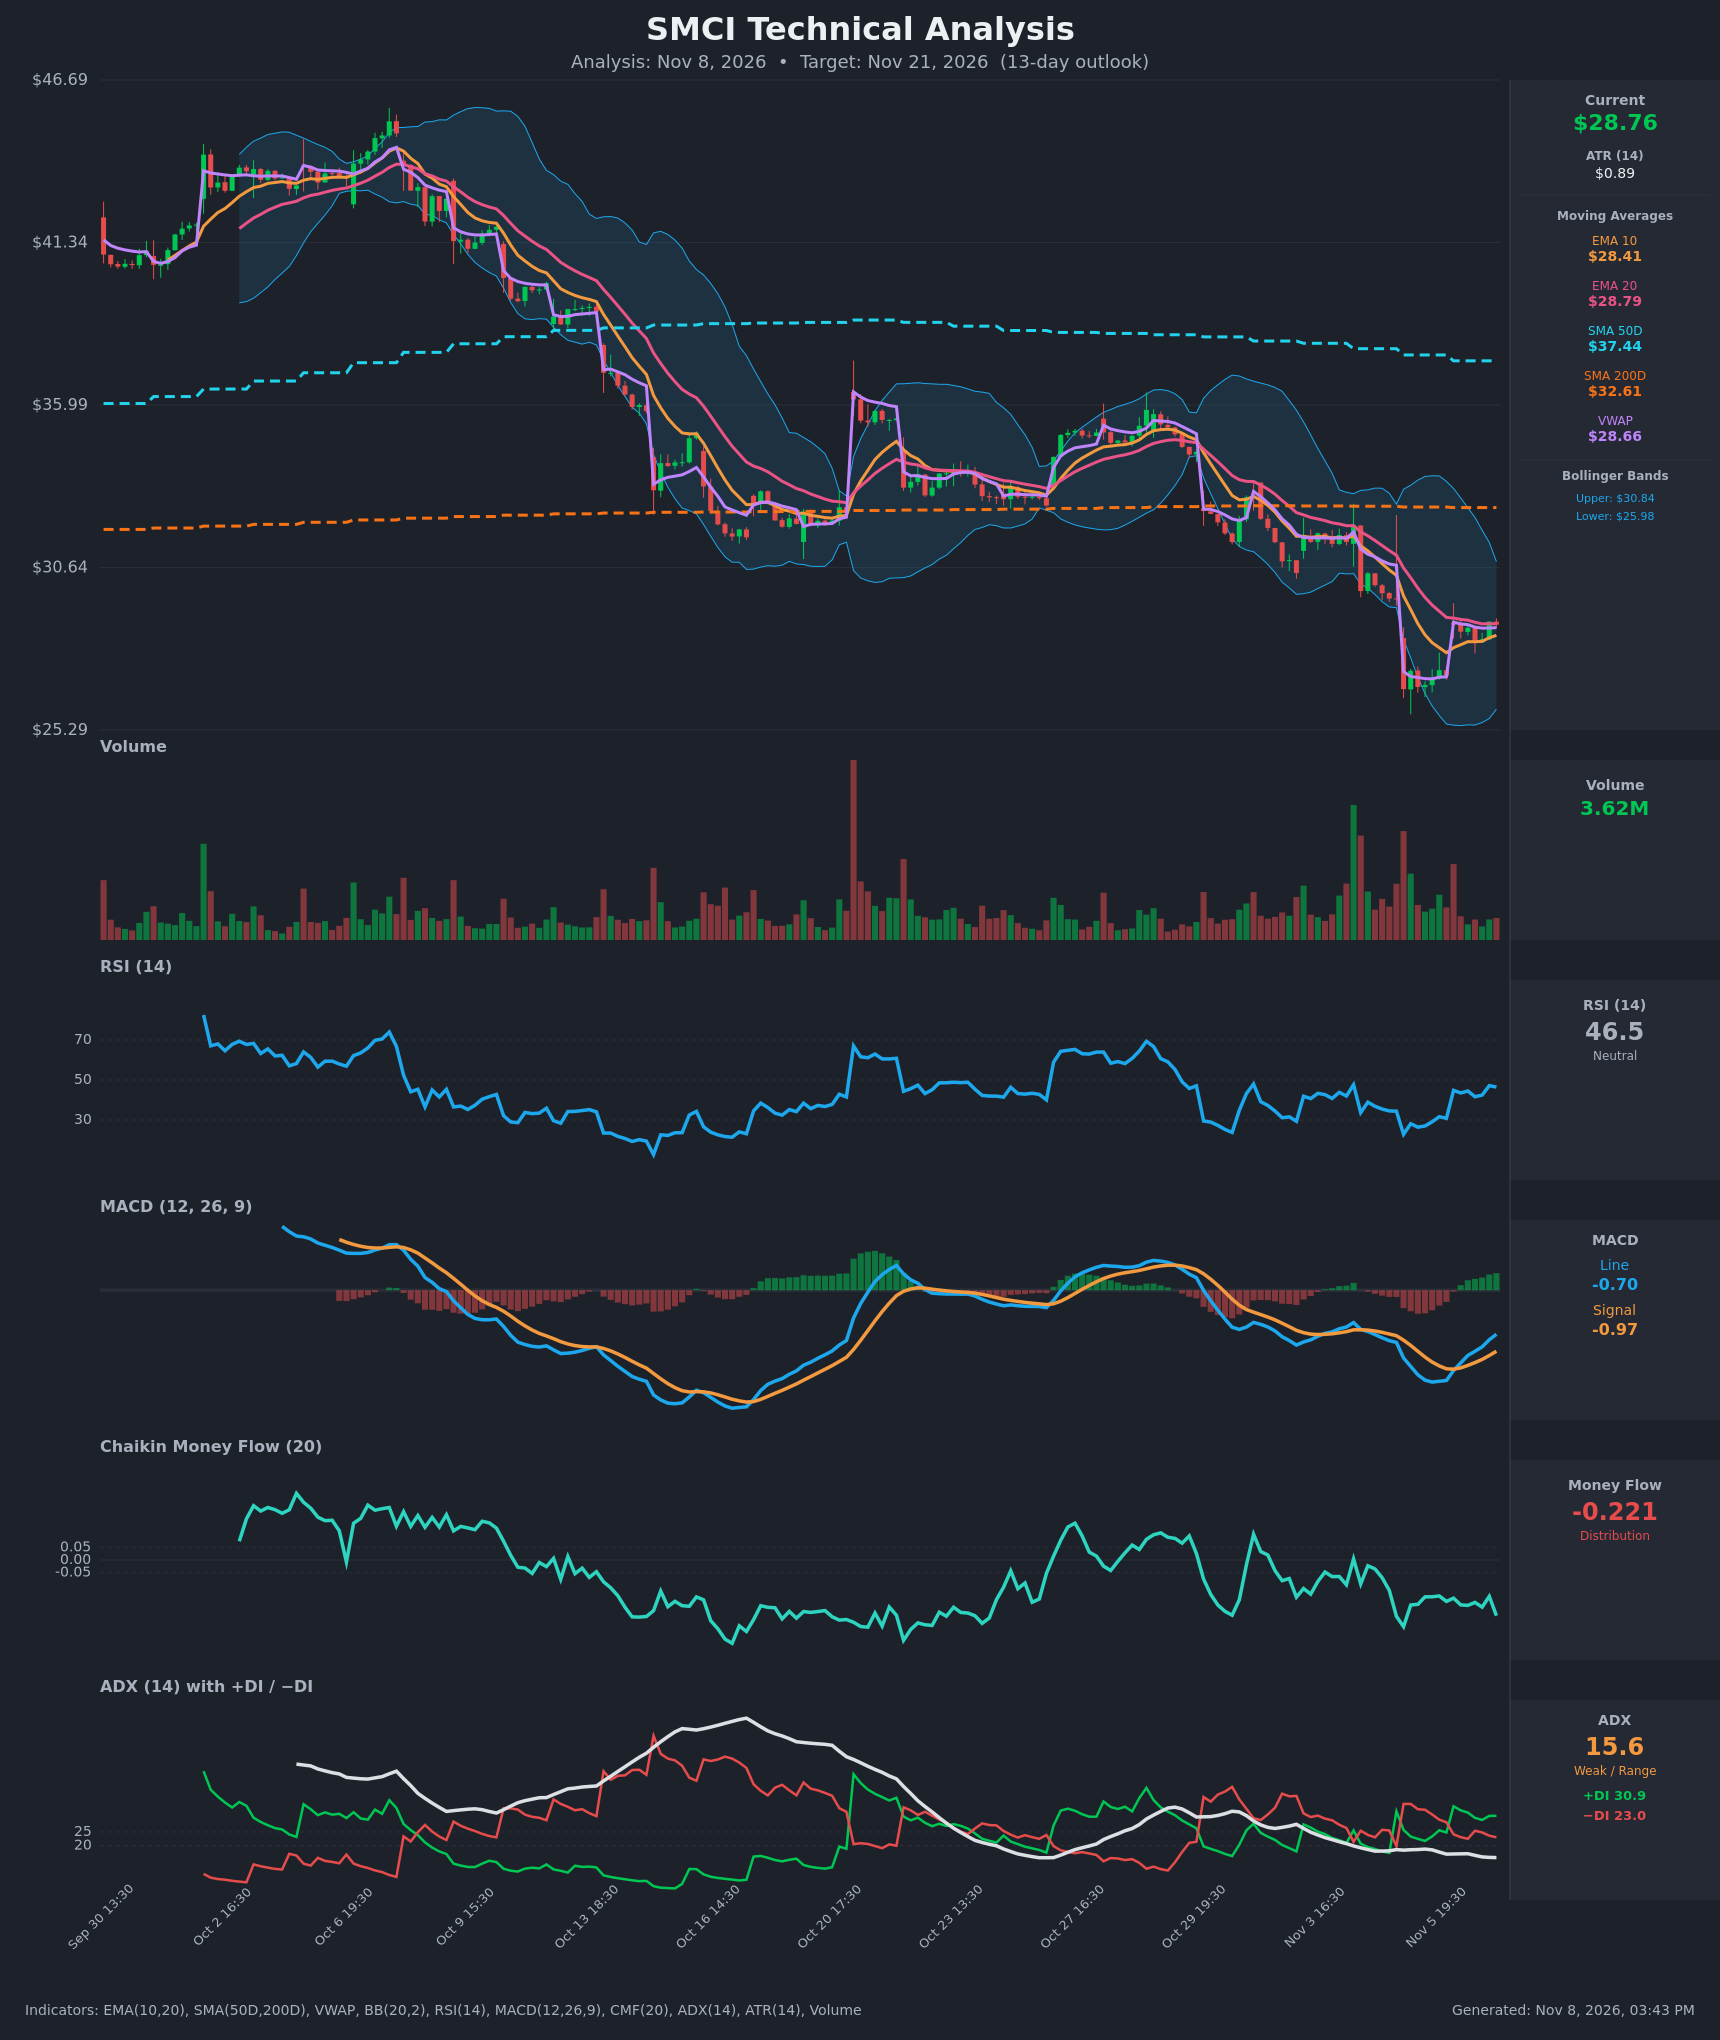
Analysis
TECHNICAL INDICATORS
- RSI (14): 46.46, recovering from the oversold 22.8 low on Nov 5 and now back near the midline. The bounce has stalled below 50, so it is a relief rally rather than a confirmed reversal. [Neutral]
- 20 EMA: $28.79, and price at $28.76 sits right on it. EMA10 ($28.41) is below EMA20 and both are still sloping down on the broader view. Flat EMA20 is acting as immediate resistance, and the bounce has not reclaimed it with conviction. [Neutral]
- MACD: Line -0.70 is above Signal -0.975, a bullish crossover on Nov 6 with a positive, rising histogram. Both lines are still well below zero, so this is a bounce within a larger downtrend. [Bullish]
- Bollinger Bands (20): Upper $30.84, lower $25.98, midline about $28.41. Price is slightly above the midline after rebounding from the lower-band tag. The bands have started to narrow after the selloff, which points to consolidation. [Neutral]
- CMF (20): -0.221, well below the -0.05 threshold. It has stayed negative throughout the rebound, which means sellers are using the bounce to distribute. [Distribution]
- ADX (14): 15.6, which is weak and range-bound. +DI (30.9) is above −DI (23.0), a short-term bullish tilt after the Nov 6 DI crossover. With ADX this low, neither side has a trend with real strength. [Weak Trend, slight bullish DI tilt]
- Volume: 3.62M, below the spikes on the prior selloff days. The rebound is occurring on light volume, which suggests weak buying participation. [Bearish-leaning / lacks conviction]
Other levels:
- Price is at VWAP ($28.66), which is neutral.
- It is far below SMA50 ($37.44) and SMA200 ($32.61).
- The death-cross structure is in place, with SMA50 well above SMA200 but both pointing down or flat and price under both.
DIVERGENCES & TRENDS
- Short-term momentum vs. money flow: RSI and MACD have turned up from their lows, but CMF made no recovery and remains around -0.2. This is a bearish divergence between momentum and volume-weighted flow.
- Trend structure: Price has made a sequence of lower highs (~$44 → ~$36 → ~$35.5 → ~$33 → ~$28.8) and lower lows, a clear long-term downtrend. The price sits below SMA50 and SMA200.
- Crossovers:
- MACD crossed bullishly but below zero.
- +DI crossed above −DI, but ADX is only 15.6.
- EMA10 is still below EMA20, and a bullish cross is not confirmed.
- Overall: Short-term indicators are improving while higher-timeframe structure and money flow remain bearish. The bounce is weak, with price stalling at the flat EMA20 and VWAP.
CHART PATTERNS
- Bearish Flag / Pennant (continuation): The sharp drop from ~$33 to ~$26.6 was followed by a tight, low-volume consolidation around $27–$29. This resembles a bearish flag or pennant. A break below ~$26.6 projects roughly $24–$25 (the flagpole is about $6, though that is a longer-range projection).
- Falling Wedge / Double Bottom (alternative reversal): The ~$26.6 low being retested would support a bullish reversal, but this requires a break above ~$30.8 on volume. It is currently not confirmed.
- Context: The pattern is incomplete. The distribution in CMF and the weak volume favor the continuation reading.
POTENTIAL SCENARIOS
- Scenario 1: Bearish Failed Bounce / Flag Breakdown — Price fails at the EMA20/VWAP zone (~$28.8–$29.0) and rolls over as distribution continues. It drifts back to the lower half of the Bollinger Bands and retests the recent lows. Trigger: rejection at $28.8–$29.0 and a close below $27.50, with a MACD histogram roll-over. Target: $27.40, then $26.00–$26.60. Invalidation: a daily close above $30.00. (50% probability)
- Scenario 2: Bullish Relief Rally — The MACD crossover and +DI lead follow through, and price reclaims EMA20 and pushes toward the upper band. Trigger: a sustained close above $29.50 with rising volume and CMF improving toward 0. Target: $30.80 (upper band), possibly $32.60 (SMA200) if momentum persists. Invalidation: a close back below $27.50. (30% probability)
- Scenario 3: Neutral Range Chop — The weak ADX holds and price oscillates between $26.60 and $29.50 around the EMA20/VWAP. Trigger: a failure to break either boundary. Target: $28.00–$28.80. Invalidation: a close outside the $26.60–$30.00 range. (20% probability)
PRICE TARGETS
- Target Price: $27.40 (13-day horizon, about -4.7%)
- Expected Range: $26.00 to $29.00 (width $3.00, about 10.4% of price, consistent with the 8–12% guidance for roughly two weeks)
- Key Levels: Support at $26.64, Resistance at $30.84
OVERALL BIAS
OVERALL BIAS: BEARISH - The chart shows a persistent long-term downtrend below SMA50 and SMA200, with CMF at -0.22 (distribution) and the rebound occurring on light volume while stalling at the flat EMA20/VWAP. The MACD crossover and +DI lead make a relief bounce plausible, but ADX is only 15.6 and the evidence favors a failed bounce or bear-flag continuation.
This is educational analysis and not financial advice.