SPCX 13-day bullish forecast — Nov 8, 2026
- Bias: Bullish
- Timeframe: 13 days (made Nov 8, 2026, target date Nov 20, 2026)
- Price at analysis: $134.19
- Price target: $138.00
- Expected range: $129.00 – $141.50
- Result: Pending — graded after the close on Nov 20, 2026
Get a free AI analysis of SPCX today
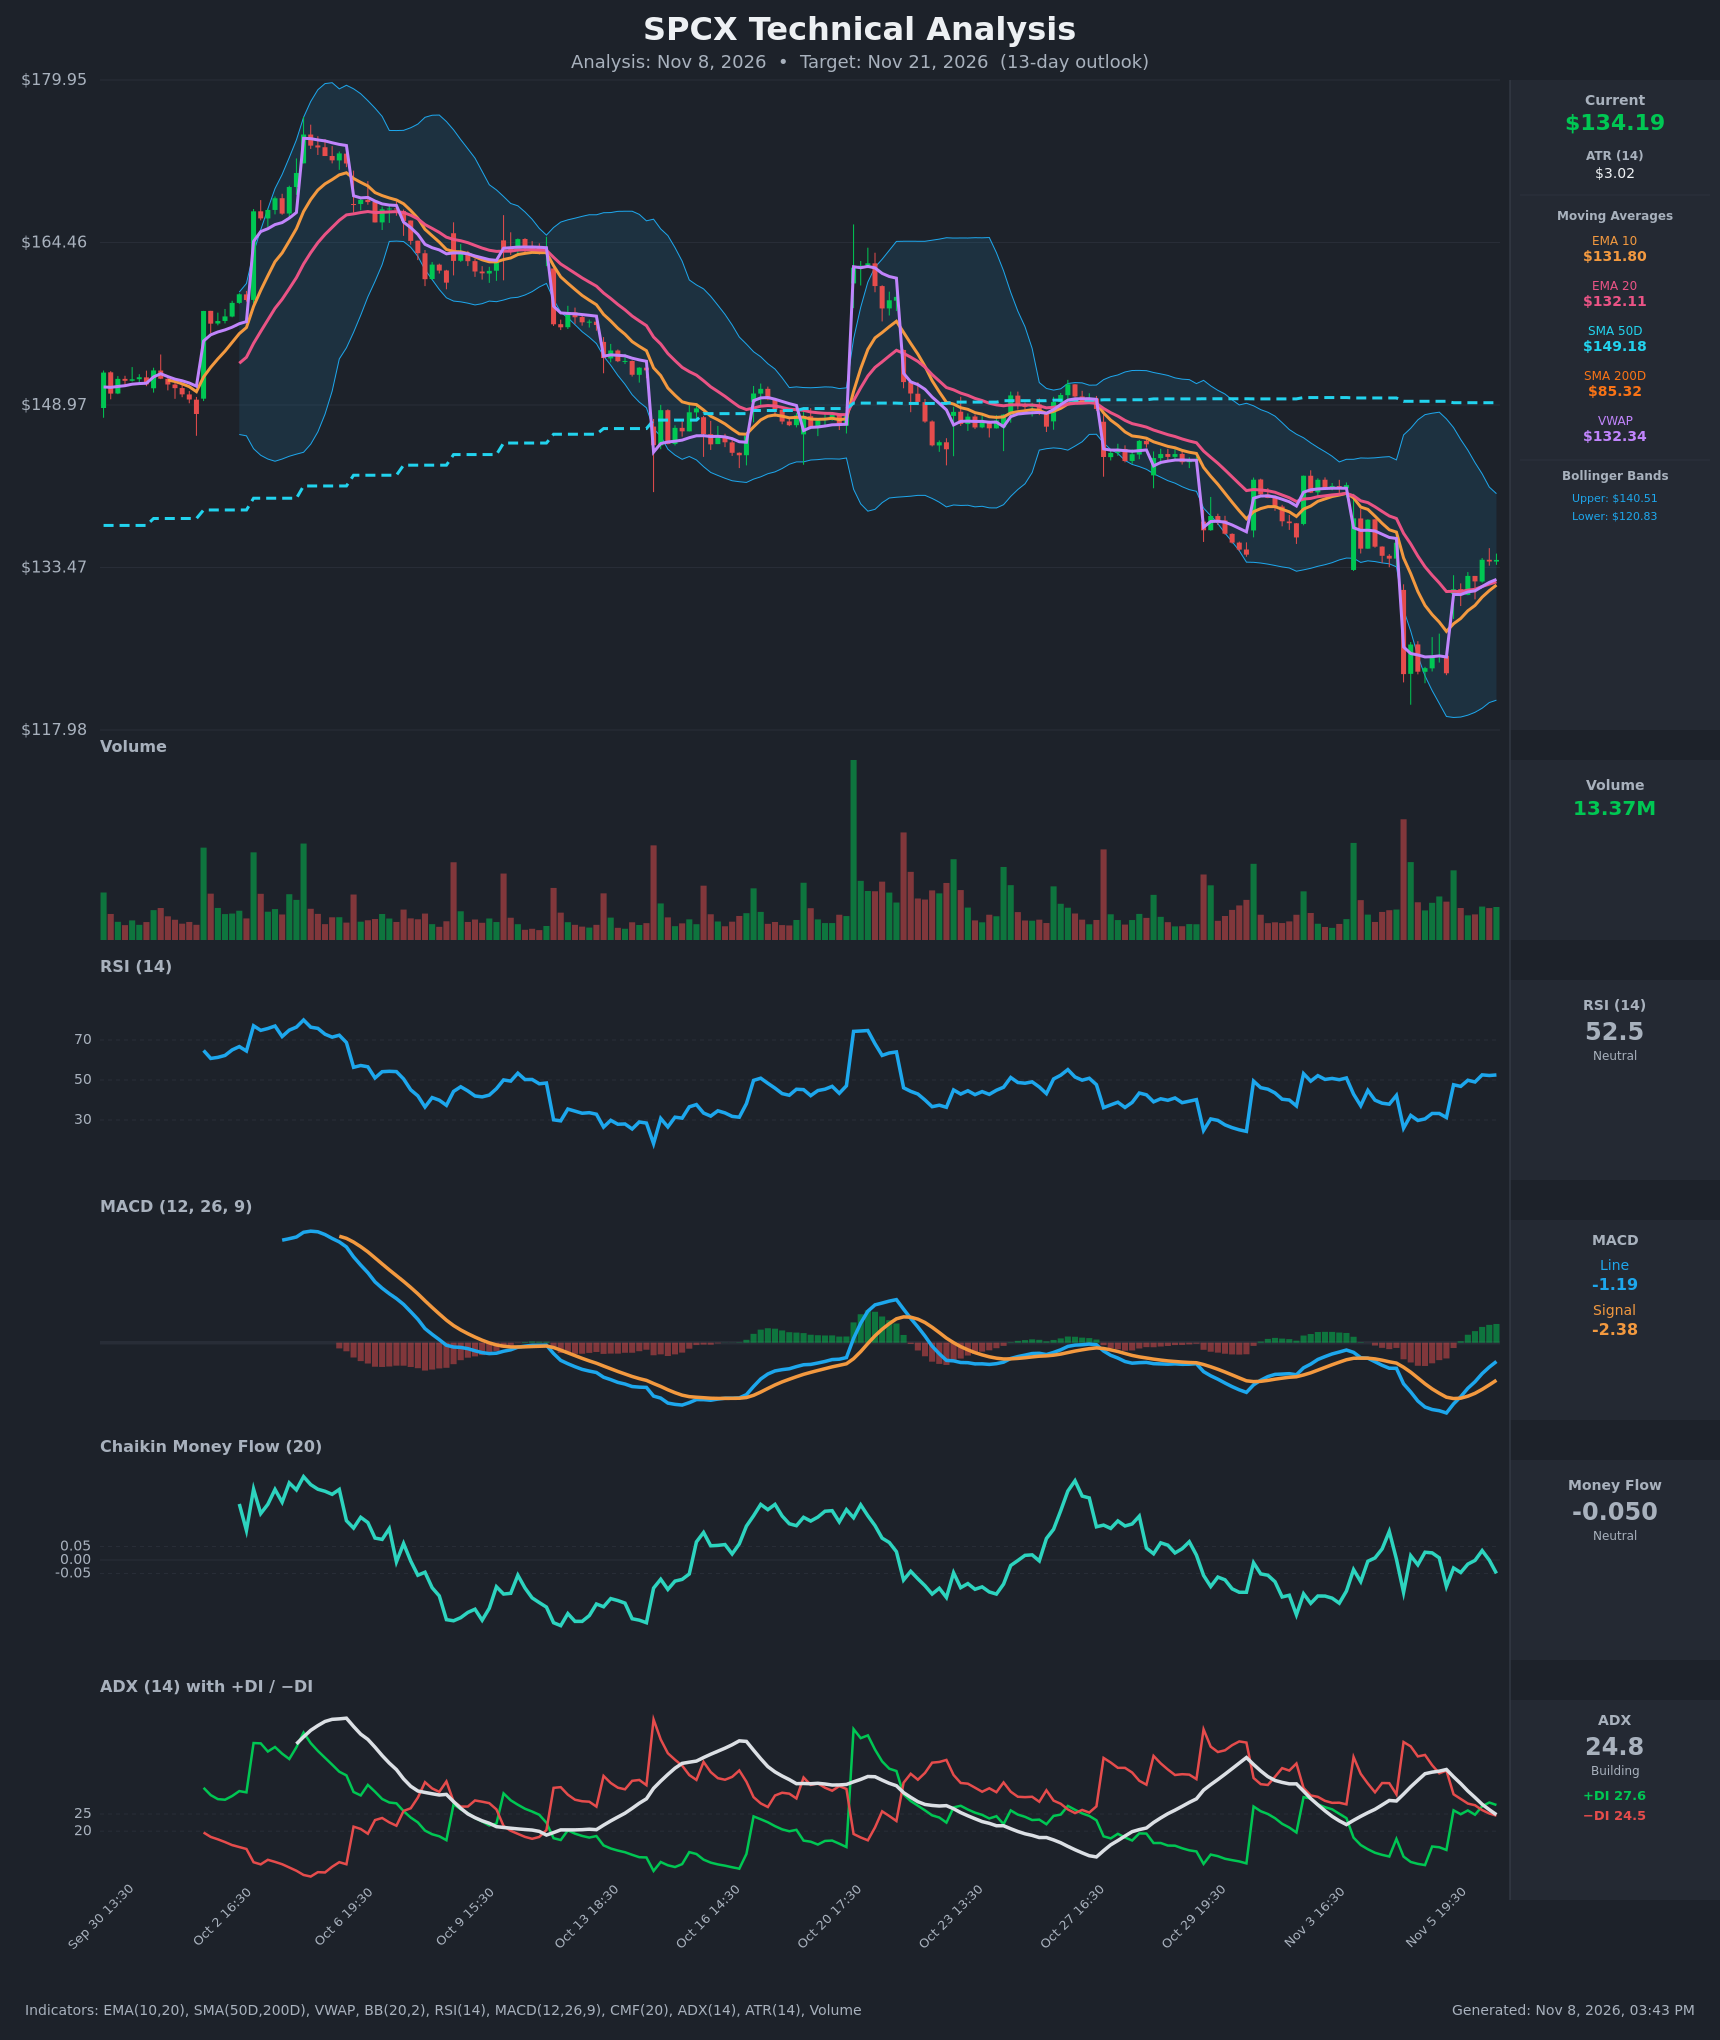
Analysis
TECHNICAL INDICATORS
- RSI (14): 52.53, up from the 26-33 oversold zone on Nov 5 and now back at the 50 midline. Momentum has recovered but is not yet strong, and there is room before overbought. [Bullish]
- 20 EMA: $132.11. Price at $134.19 is above it, so it now acts as support. EMA10 ($131.80) is still marginally below EMA20, but the gap has narrowed from about -$3.3 to -$0.3, so a bullish EMA10/20 cross is imminent. [Bullish]
- MACD: Line -1.19, signal -2.38, histogram +1.19 and expanding. The line crossed above the signal around Nov 6 15:30. Both remain below zero, so this is a recovery inside a larger downtrend. [Bullish]
- Bollinger Bands (20): Upper $140.51, lower $120.83, midline about $130.67. Price rebounded from the lower band and now sits above the midline. The upper band at about $140.5 is the natural next test, and the bands are still wide, which implies elevated volatility. [Bullish]
- CMF (20): -0.050, exactly at the distribution threshold. It has hovered around zero for the last 15 bars and has not confirmed the price rebound with accumulation. [Neutral]
- ADX (14): 24.8, falling from 37.9. +DI (27.6) crossed above −DI (24.5) on Nov 6, so the bearish trend is fading and control is shifting to buyers. A reading just below 25 shows no strong trend in either direction yet. [Weak Trend, tilting Bullish]
- Volume: 13.37M, moderate and not a surge. The Nov 5 capitulation bar had heavy volume, but the rebound is on average to below-average volume, so the bounce lacks strong conviction. [Neutral]
Other context: price is above VWAP ($132.34), which is mildly bullish. It is far above SMA200 ($85.32), so the long-term uptrend is intact. It is well below SMA50 ($149.18), which is overhead resistance and slowly falling. There is no golden or death cross (SMA50 is far above SMA200).
DIVERGENCES & TRENDS
- Bullish momentum divergence (minor): On Nov 5 price made lows of $123.3-123.9 while RSI stayed around 30 and MACD kept falling. The subsequent reversal shows the selling was exhausted.
- Crossovers: MACD turned bullish, +DI crossed above −DI, and EMA10 is closing in on EMA20. All of these are short-term bullish.
- Missing confirmation: CMF has not turned positive and volume is subdued during the rally. The bounce is therefore not yet backed by accumulation.
- Larger trend: Price has made lower highs since the October peak near $175, with spikes to roughly $165 and $150 failing. SMA50 at $149 sits well above price, so the intermediate trend is still down and rallies face resistance.
- ADX decline: ADX has fallen from 37.9 to 24.8, so downside trend strength is waning and a transition or range is forming.
CHART PATTERNS
- Bullish Triple/Double Bottom (reference: Bullish Double/Triple Bottom): Repeated lows at about $123.3-123.9 on Nov 5 formed a base, and price has since broken above the intraday neckline near $126-131. The measured move from the base (about $123 low to $131 neckline, roughly $8) projects to about $139-140. That matches the upper Bollinger Band.
- Larger descending structure (lower highs): The broader decline resembles a falling channel and may be a Bullish Falling Wedge, but it is not confirmed until price clears the $140-149 area.
- Caveat: If the rebound stalls at $140-142, it would be a bear-flag/relief rally within the downtrend. Resistance at SMA50 ($149) caps any larger recovery in this window.
POTENTIAL SCENARIOS
- Scenario 1: Bullish Base Breakout and Relief Rally — The double/triple bottom and MACD/DI crossovers carry price to the upper Bollinger Band. Trigger: hold above $132 and EMA10 crossing above EMA20. Target: $138-140.50. Invalidation: a close below $128. (50% probability)
- Scenario 2: Bearish Failed Bounce Back to the Lows — The relief rally stalls on weak volume and CMF stays at distribution levels. Sellers regain control in line with the lower-high downtrend. Trigger: loss of EMA20/VWAP at about $132 and MACD histogram rolling over. Target: $125-127, with a retest of $123. Invalidation: a daily close above $140.5. (30% probability)
- Scenario 3: Neutral Range-Bound Consolidation — With ADX below 25 and price between EMA support at $132 and the upper band at $140.5, price chops sideways. Trigger: repeated rejections at $138-140 and bounces at $131-132. Target: $131-137. Invalidation: a break outside $128-141. (20% probability)
PRICE TARGETS
For a 13-day horizon, the Expected Range width is about $12.50, or roughly 9.3% of the current price. This falls between the 7-10 day (4-8%) and 14-21 day (8-12%) guidance.
- Target Price: $138.00 (13-day outlook)
- Expected Range: $129.00 to $141.50
- Key Levels: Support at $132.10, Resistance at $140.50
OVERALL BIAS
OVERALL BIAS: BULLISH - The base at about $123 held. MACD and DI crossovers are bullish, and price is above EMA20/VWAP with RSI recovering to 50. The upside is likely capped near the $140.5 upper band and the falling SMA50, and neutral CMF and light volume limit conviction.
This is educational analysis and not financial advice.