TLT 13-day bullish forecast — Nov 8, 2026
- Bias: Bullish
- Timeframe: 13 days (made Nov 8, 2026, target date Nov 20, 2026)
- Price at analysis: $81.92
- Price target: $82.55
- Expected range: $79.00 – $84.60
- Result: Pending — graded after the close on Nov 20, 2026
Get a free AI analysis of TLT today
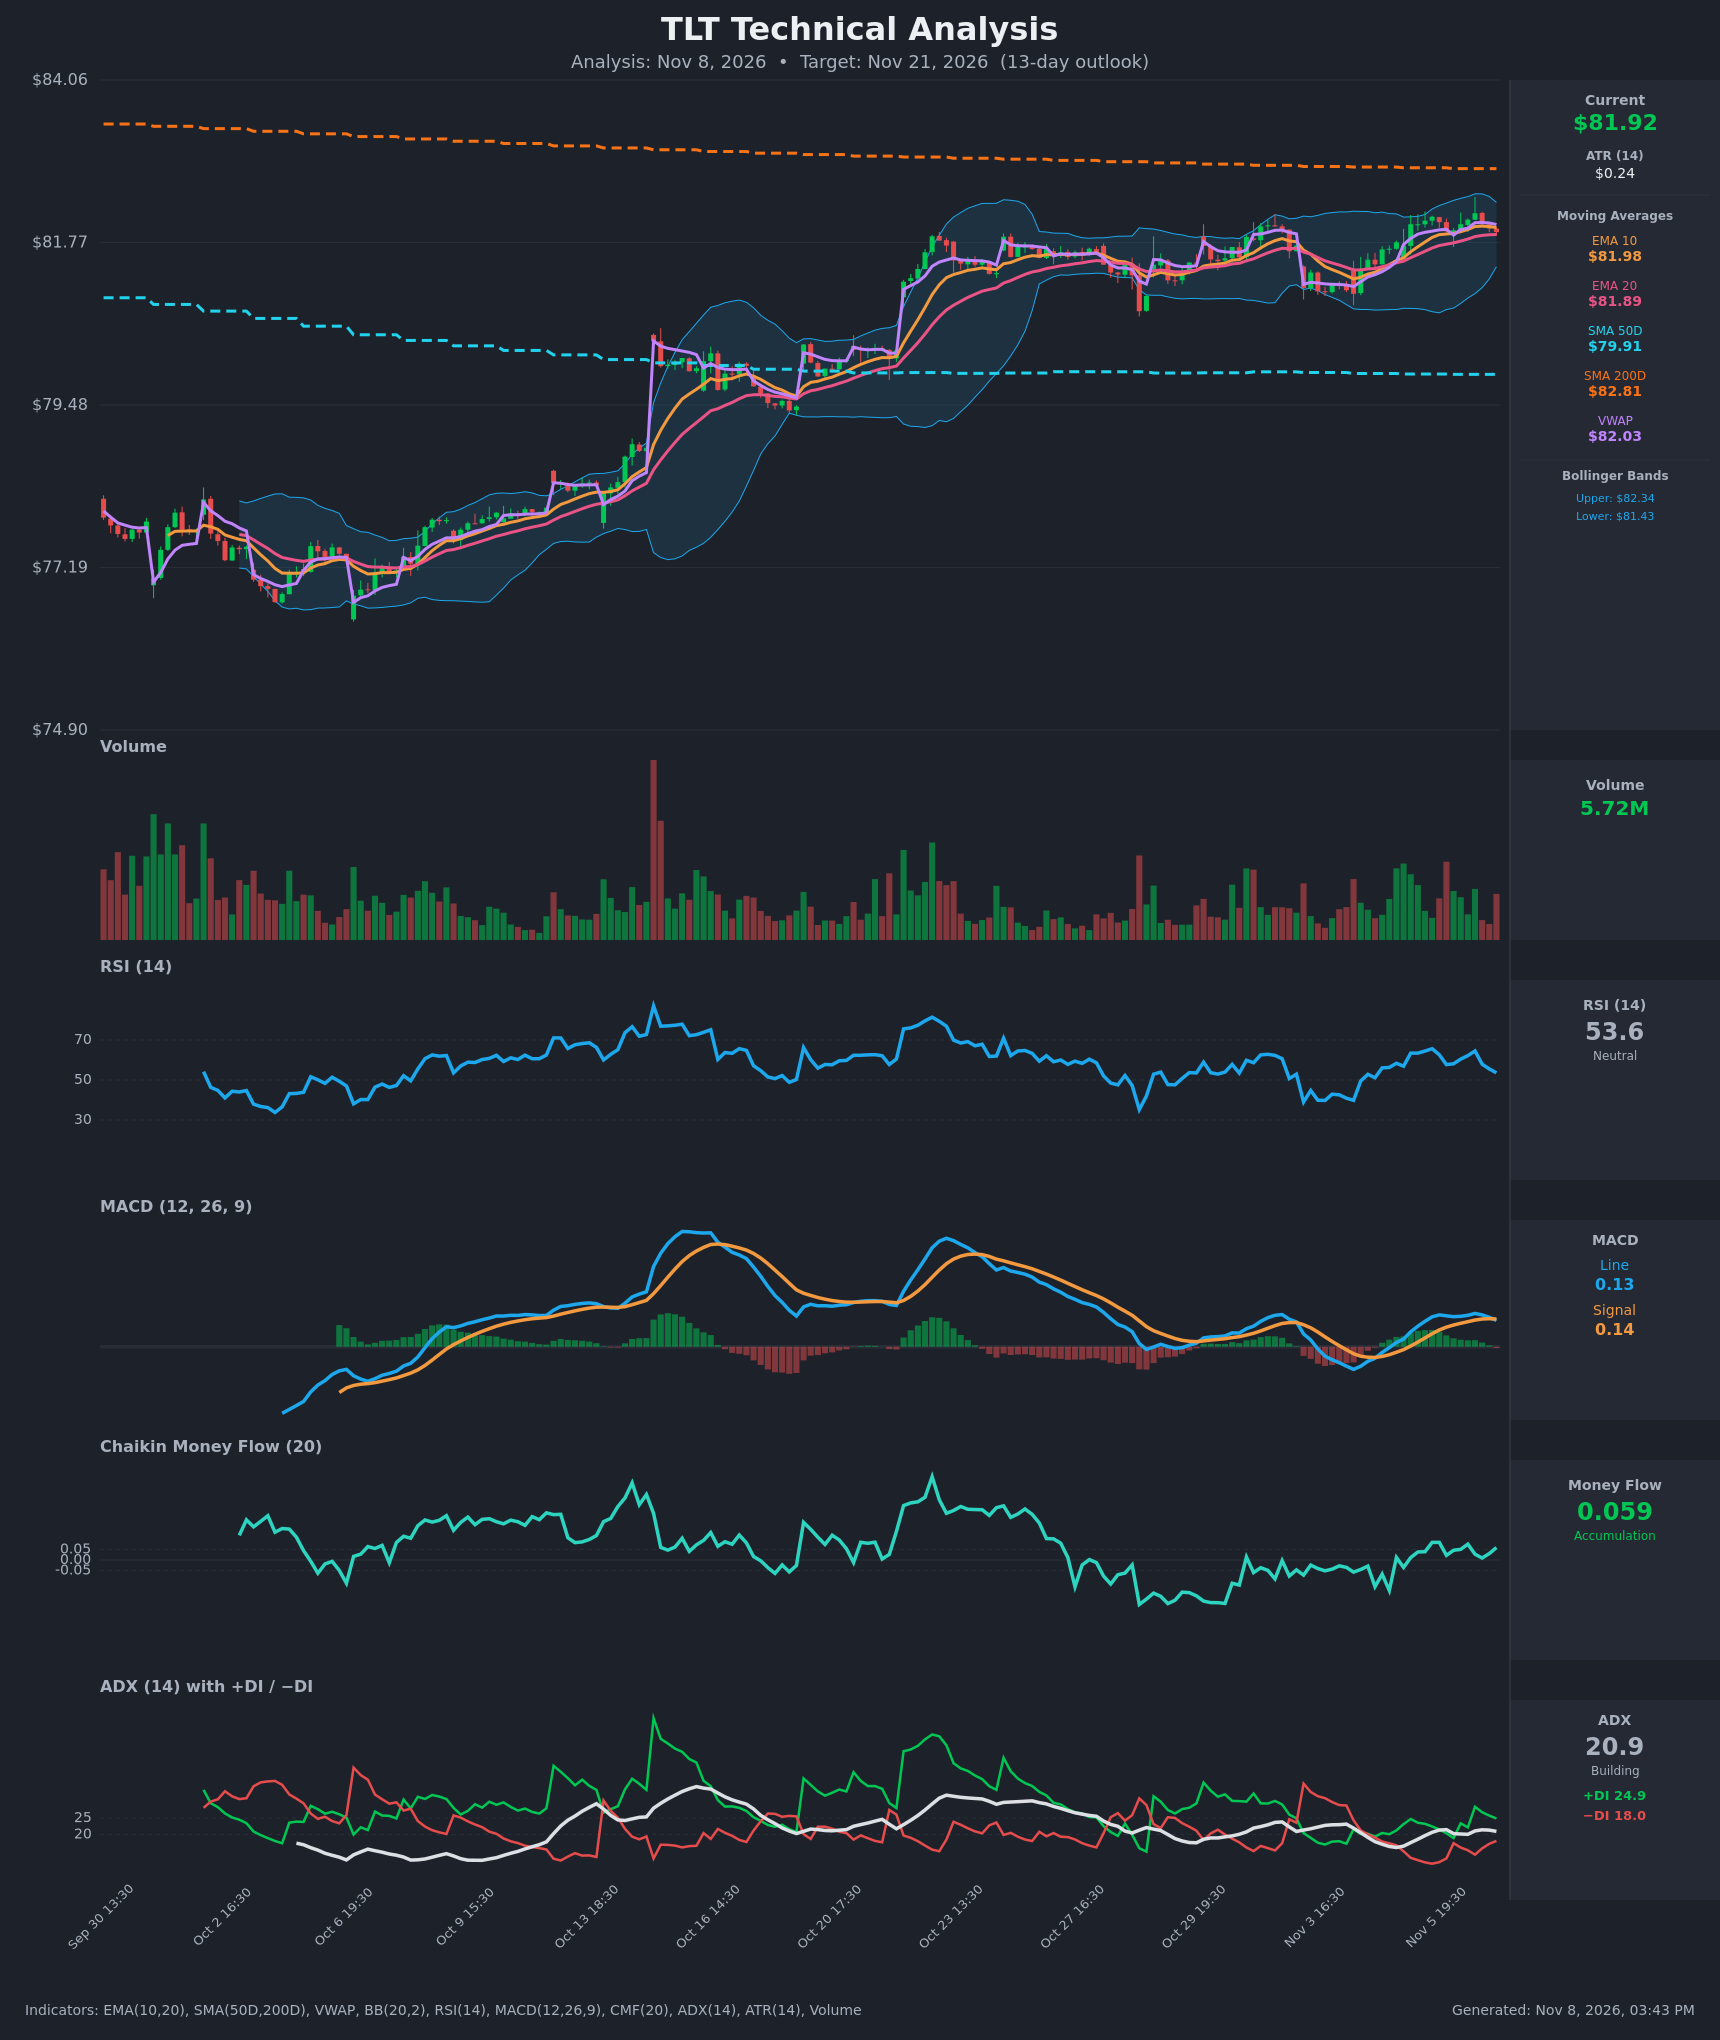
Analysis
TECHNICAL INDICATORS
- RSI (14): 53.58, down from a 65.6 peak on Nov 5 and drifting back toward the 50 midline. It is neither overbought nor oversold. Momentum is fading in the short term, but the reading stays above 50. [Neutral]
- 20 EMA: $81.89, with price at $81.92 just above it. The EMA10 ($81.98) is still above the EMA20, so the bullish alignment holds, but the gap is narrowing and price has slipped below the EMA10. The 20 EMA is the first support. [Neutral]
- MACD: Line 0.131 against signal 0.138, a fresh bearish crossover on the last bar. The histogram has just turned slightly negative after peaking around Nov 6 17:30. The lines are still above zero, so this reads as a momentum pause rather than a reversal. [Bearish]
- Bollinger Bands (20): Upper $82.34, lower $81.43, midline about $81.88. Price sits on the midline. The bands are narrow compared with the October expansion, which signals compression and a likely volatility expansion ahead. [Neutral]
- CMF (20): 0.059, barely above the +0.05 accumulation threshold. It has been mostly positive over the last few sessions, which shows mild buying pressure, but it is not decisive. [Accumulation]
- ADX (14): 20.9 with +DI 24.9 and −DI 18.0. The trend is weak, at the edge of range-bound, and bulls hold the edge: +DI is above −DI, though the spread is narrowing from its Nov 5 widest point. [Weak Trend, Bullish lean]
- Volume: 5.72M, with no climactic spikes during the recent consolidation. Volume is below the October breakout spike, so conviction is low. The recent up-bars have slightly heavier volume than the down-bars. [Neutral/Slightly Bullish]
Moving-average context:
- Price is below the SMA200 ($82.81), which is a long-term resistance.
- Price is above the SMA50 ($79.91), which is rising or flat and acts as a deeper support.
- Price is slightly below VWAP ($82.03), which is a minor short-term headwind.
- The SMA50 remains below the SMA200 (death-cross configuration), but the gap is stable at about $2.90 and not widening.
DIVERGENCES & TRENDS
- There is no clear divergence. Price is making higher lows and similar highs while RSI is cooling, a mild loss of momentum rather than a true bearish divergence.
- MACD has just crossed bearishly, while the longer structure is a base-and-recovery from about $77 to $82.
- The ADX is lifting off its lows, but the +DI/−DI spread is shrinking. The market is waiting for direction.
- Price is compressing between the $81.43 lower band and $82.34 upper band, below the SMA200 at $82.81. Higher lows since Oct 29–Nov 3 (roughly $80.7 to $81.4) show buyers stepping in earlier on each dip.
- The EMA10 and EMA20 are bullishly stacked, but the bearish MACD cross signals a near-term pullback toward the EMA20 or lower band before the next leg.
CHART PATTERNS
- Ascending Triangle / Bullish Flag-like consolidation (continuation): Since the Oct 23 thrust, price has held a $81–82.3 range, with higher lows against a flat-to-slightly-rising ceiling around $82.2–82.4. The reference diagram's ascending triangle implies an upside break. The measured move is the pattern height (about $1.3–1.5) added to the break level, which gives roughly $83.5–83.8. The SMA200 at $82.81 is the first major obstacle.
- Rejected alternative: A Bearish Double Top or Rising Wedge is not clearly formed. Price has not broken below the rising lows, so the bearish reversal patterns are not confirmed.
- Failure condition: A close below about $81.0 would invalidate the higher-low structure and point to a retest of the $79.9 SMA50.
POTENTIAL SCENARIOS
- Scenario 1: Bullish Ascending-Triangle Breakout — Price holds above the EMA20 and lower band, then pushes through $82.40 and tests the SMA200, helped by mild accumulation and +DI dominance. Trigger: close above $82.40 on rising volume, with the MACD re-crossing up. Target: $82.80–$83.60. Invalidation: close below $81.40. (45% probability)
- Scenario 2: Neutral Range Chop — Price remains pinned between $81.40 and $82.40 as ADX stays near 20 and the SMA200 caps rallies. Trigger: failure to close above $82.40 or below $81.40. Target: $81.60–$82.20. Invalidation: a decisive close outside the range on volume. (30% probability)
- Scenario 3: Bearish Failure / Pullback — The MACD bearish cross extends, price loses the lower Bollinger Band and the higher-low structure breaks. This would come as RSI slips under 45 and −DI rises. Trigger: close below $81.40, then below $81.00. Target: $80.00–$80.70, near the SMA50. Invalidation: reclaim of $82.00. (25% probability)
PRICE TARGETS
For the 13-day timeframe (to Nov 21, 2026):
- Target Price: $82.55
- Expected Range: $79.00 to $84.60 (width $5.60, about 6.8% of the current price, within the 4–8% guidance for this horizon)
- Key Levels: Support at $81.43, Resistance at $82.81
OVERALL BIAS
OVERALL BIAS: BULLISH - Higher lows within a tight $81–82.4 consolidation, +DI above −DI, mild CMF accumulation and a stacked EMA10/EMA20 favor an upside break toward the $82.81 SMA200. The fresh MACD bearish cross, weak ADX and the SMA200 overhead keep conviction modest, with a pullback to the lower band possible first.
This is educational analysis and not financial advice.