TQQQ 13-day bearish forecast — Nov 8, 2026
- Bias: Bearish
- Timeframe: 13 days (made Nov 8, 2026, target date Nov 20, 2026)
- Price at analysis: $52.25
- Price target: $50.50
- Expected range: $48.00 – $53.50
- Result: Pending — graded after the close on Nov 20, 2026
Get a free AI analysis of TQQQ today
Analysis
TECHNICAL INDICATORS
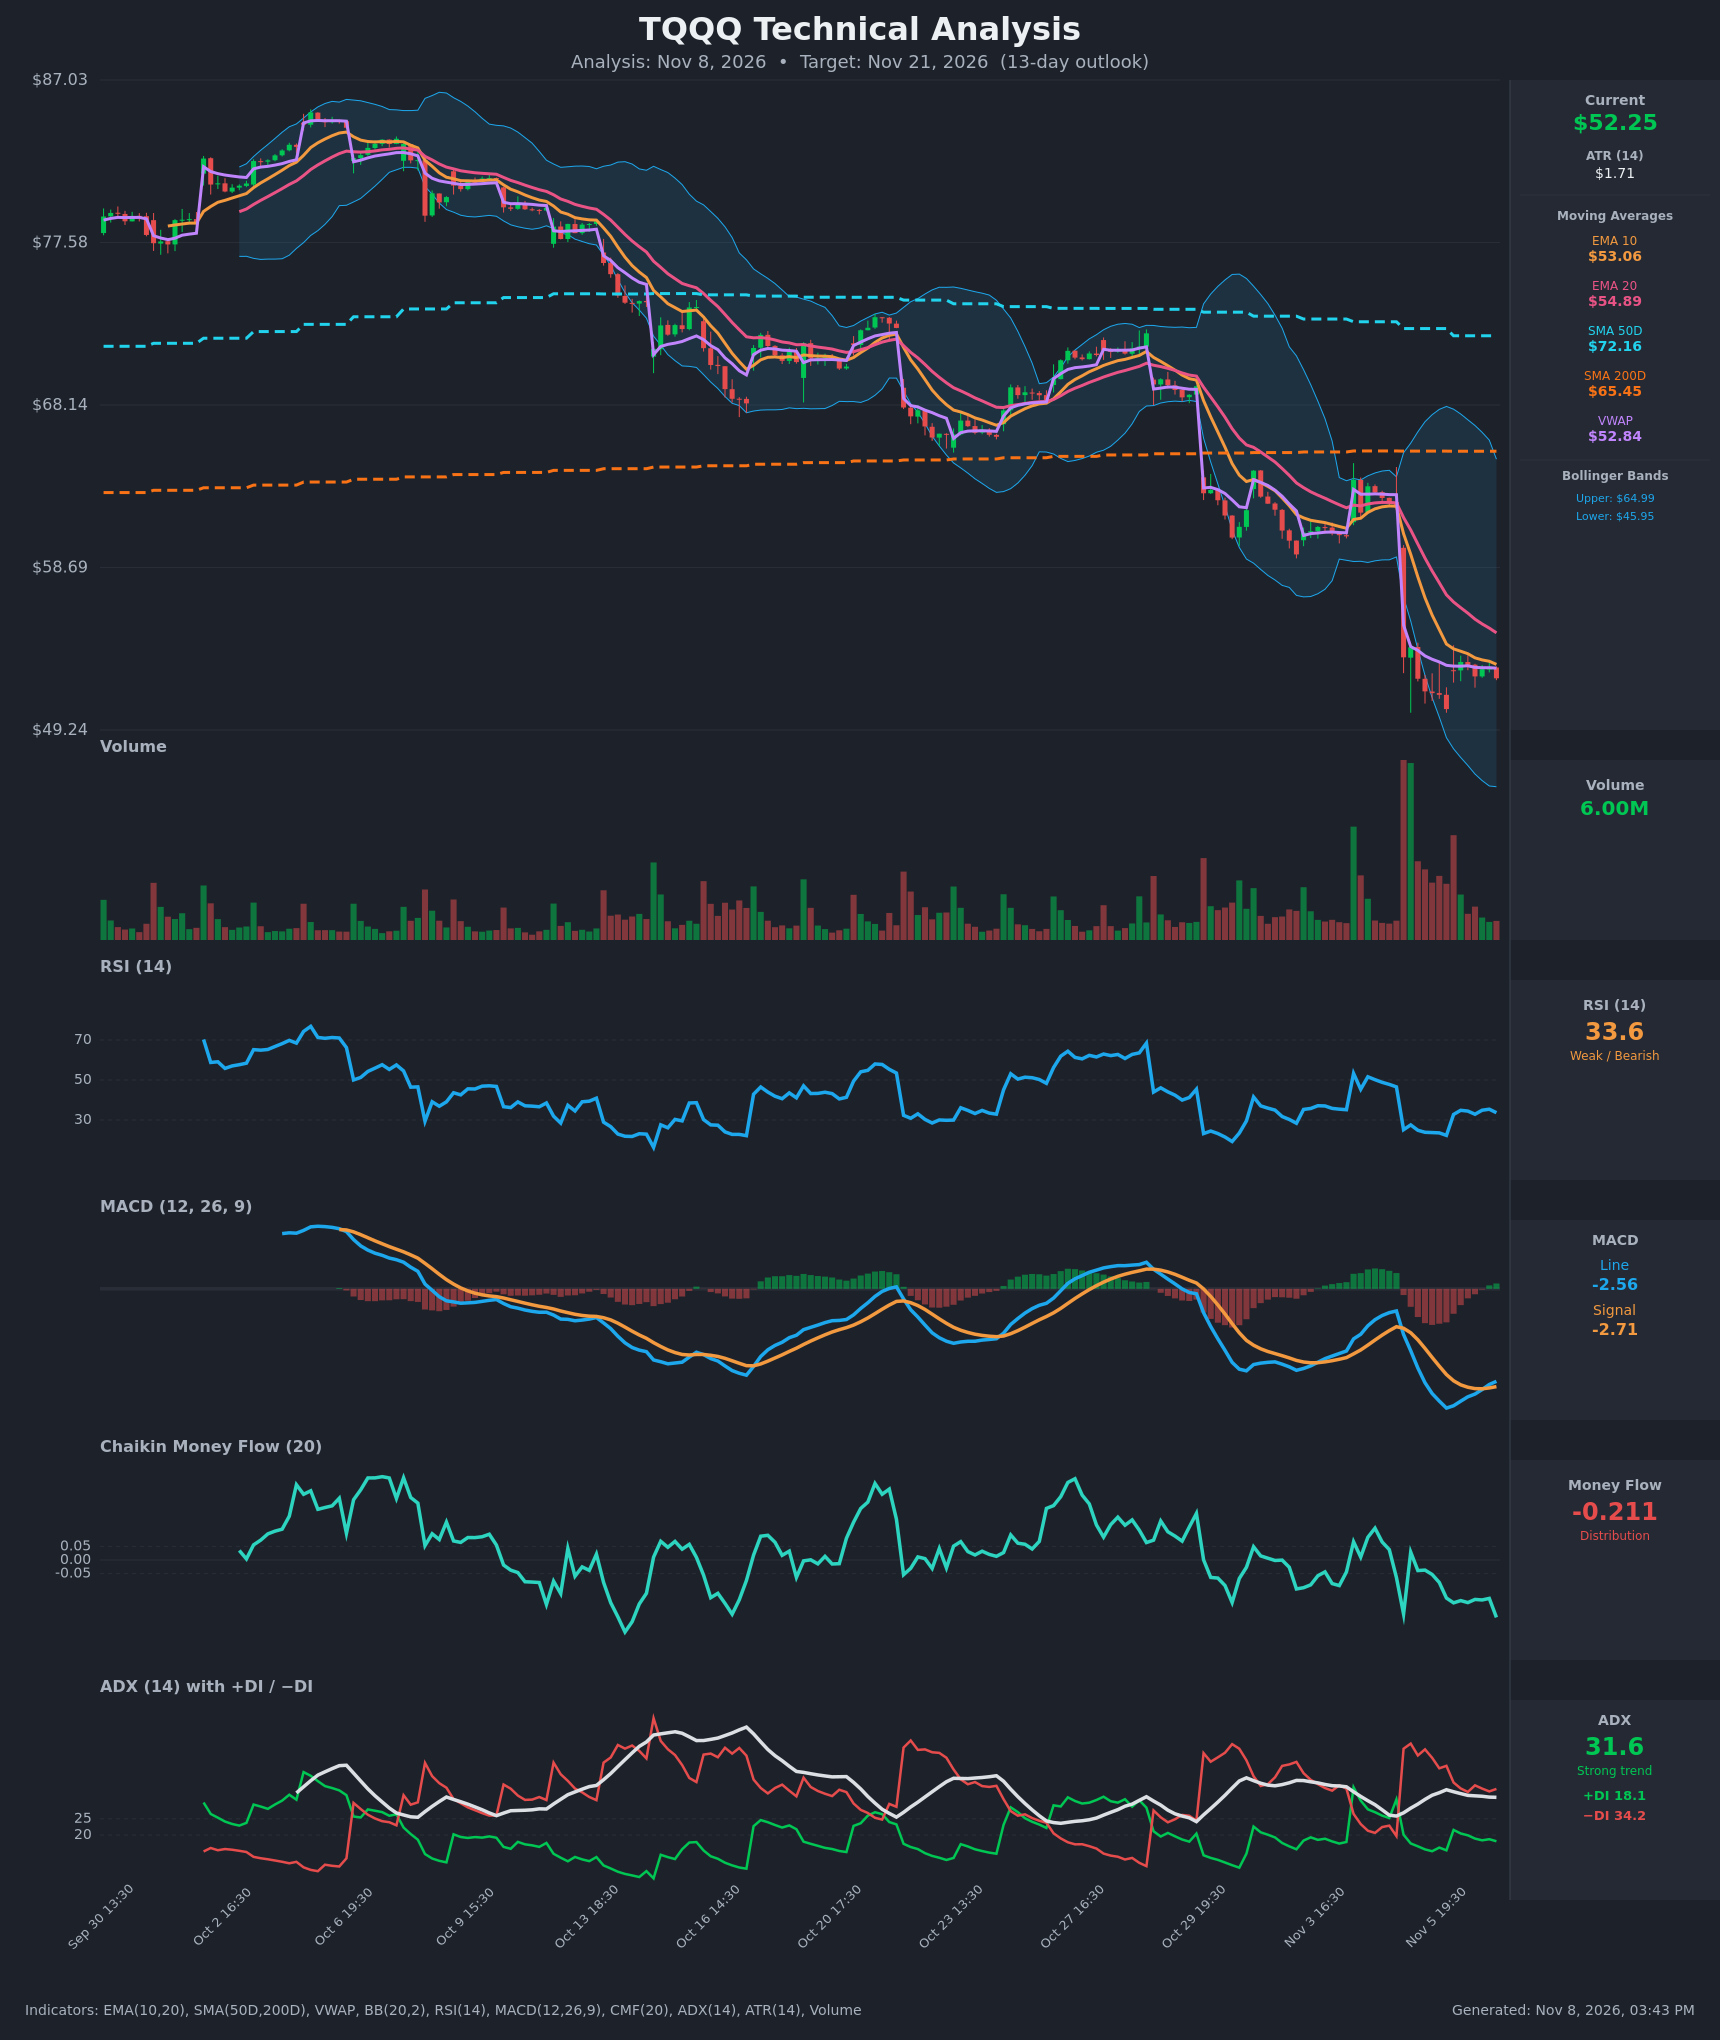
- RSI (14): 33.65, just above the oversold line of 30. It plunged to about 22-25 after the Nov 5 gap down and has only recovered into the low-to-mid 30s. It is weak, with no real momentum recovery yet. [Bearish]
- 20 EMA: $54.89, with the 10 EMA at $53.06. Price ($52.25) is below both, and EMA10 is below EMA20, so the short-term trend stays bearish. The 20 EMA is falling and sits about 5% overhead as resistance. [Bearish]
- MACD: Line -2.564 versus signal -2.711, so the histogram is slightly positive (about +0.15). The line crossed above the signal on Nov 6 at 19:30 but remains deeply negative, well below zero. This is a mild bullish crossover that looks like a relief bounce within a downtrend rather than a trend reversal. [Neutral]
- Bollinger Bands (20): Upper $64.99, lower $45.95, a very wide band after the gap-down volatility spike. Price is in the lower half of the bands, below the midline (about $55.5), and about $6.3 above the lower band. This shows a bearish position but no extreme stretch. [Bearish]
- CMF (20): -0.211, well below -0.05. It is falling again, so selling pressure and distribution dominate. [Distribution]
- ADX (14): 31.6 with +DI 18.1 and −DI 34.2. A strong trend is in place and bears are clearly in control. ADX is drifting down from its 33.9 peak, so trend strength is cooling slightly. [Strong Trend – Bearish]
- Volume: 6.00M, drifting lower on the recent bars. Capitulation volume came on the Nov 5 gap down, and the volume on the bounce attempts is light, so buyers lack conviction. Price is also below VWAP ($52.84). [Bearish / Weak Bounce Interest]
DIVERGENCES & TRENDS
- There is no clear bullish RSI divergence. RSI printed a higher low (about 33 versus 22), but price made only a marginal new low, so this is a mild momentum stabilization rather than a divergence.
- The MACD line is curling up and has crossed its signal, while CMF is making fresh lows (-0.211) and +DI is flat. Momentum has stabilized, but money flow does not confirm a bounce.
- The SMA50D ($72.16) is above the SMA200D ($65.45), so there is no death cross yet. Price is well below both, and the SMA50D is rolling over, so a death cross is possible in coming weeks.
- EMA10 is below EMA20 and the gap is narrowing slowly as price consolidates, but there is no bullish crossover.
- Price has been stuck in about $50.5-$53.2 for two sessions after the gap down from $62, which is a tight consolidation under VWAP.
CHART PATTERNS
- Bearish Flag / Pennant (continuation): The sharp drop from about $62 to about $50 (the "pole") is followed by a tight, sideways-to-slightly-upward consolidation in the $50.5-$53.2 area. A breakdown below about $50.40 would project a measured move toward the high-$40s, around the lower Bollinger Band ($45.95).
- Larger structure: The lower-high, lower-low sequence since the early-October peak near $85 is a persistent descending channel. Repeated rallies have failed at the EMA20/VWAP area.
- Bullish Falling Wedge / Double Bottom: Neither has formed. A stronger bounce would only be credible on a reclaim of $54.89 (EMA20) with CMF turning positive.
POTENTIAL SCENARIOS
- Scenario 1: Bearish Flag Breakdown / Trend Continuation — Price fails at the EMA10/VWAP zone (about $53), loses the two-day base, and resumes the downtrend as distribution and −DI dominance persist. Trigger: close below $50.40-$50.50 on rising volume. Target: $48.00-$49.00, with an extension toward $46 (lower BB). Invalidation: close above $54.90 (EMA20). (50% probability)
- Scenario 2: Bullish Relief Bounce — Oversold conditions and the MACD bullish crossover lead to a mean-reversion rally in this leveraged ETF. Trigger: break above $53.50 with improving CMF. Target: $55-$57 (EMA20 and the Bollinger midline area). Invalidation: close back below $51.00. (35% probability)
- Scenario 3: Neutral Range Chop — Price keeps oscillating between $50.50 and $53.50 as volatility compresses. Trigger: ADX continues to fall with price pinned near VWAP. Target: about $52. Invalidation: a close outside $50-$54. (15% probability)
PRICE TARGETS
- Target Price: $50.50 (13 days)
- Expected Range: $48.00 to $53.50 (width $5.50, about 10.5% of current price, consistent with the 13-day timeframe)
- Key Levels: Support at $50.00, Resistance at $54.89
OVERALL BIAS
OVERALL BIAS: BEARISH - Price sits below all key moving averages and VWAP, with −DI far above +DI, ADX above 30, and CMF at -0.211 showing distribution. The tight consolidation after the gap down looks like a bearish flag. The MACD crossover and the near-oversold RSI argue for a possible relief bounce, but that bounce lacks volume and money-flow confirmation.
This is educational analysis and not financial advice.