TSLA 13-day bearish forecast — Nov 8, 2026
- Bias: Bearish
- Timeframe: 13 days (made Nov 8, 2026, target date Nov 20, 2026)
- Price at analysis: $358.16
- Price target: $350.00
- Expected range: $338.00 – $374.00
- Result: Pending — graded after the close on Nov 20, 2026
Get a free AI analysis of TSLA today
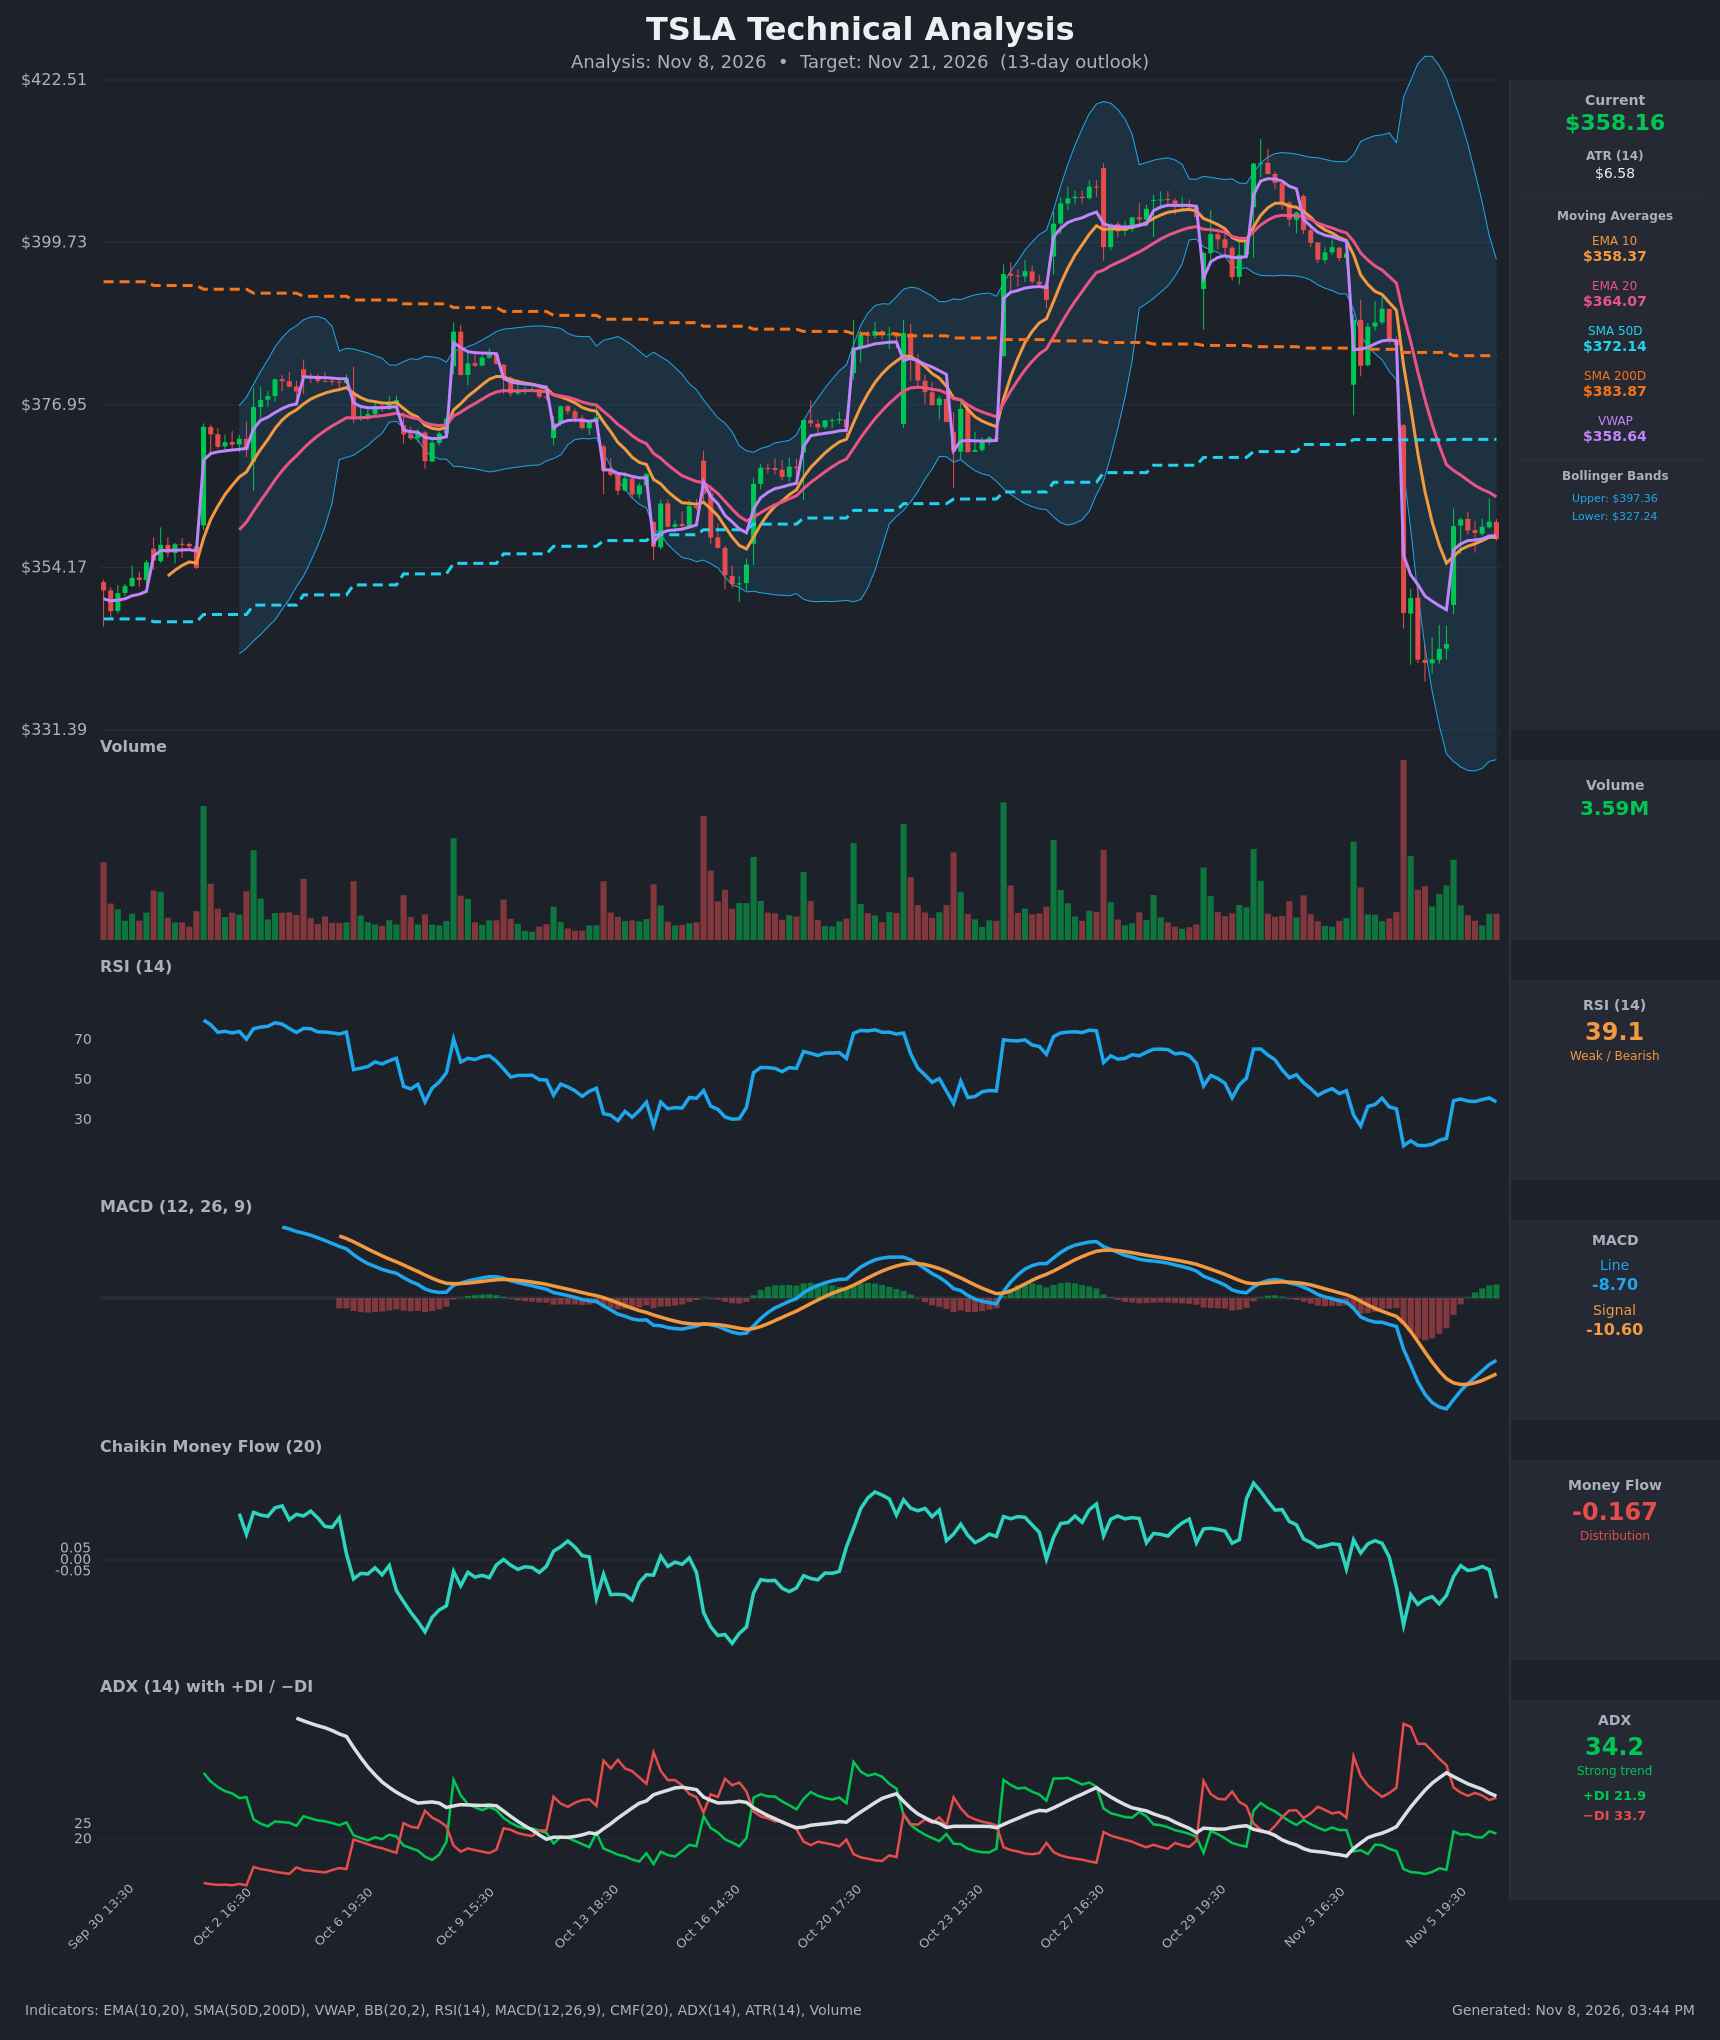
Analysis
TECHNICAL INDICATORS
- RSI (14): 39.05, recovering from a deeply oversold 17.1 on Nov 5 but stalled in the 39-41 zone for the last several bars. It is below 50 and has not reclaimed the 40-45 area where rallies have stalled, so momentum is still weak. [Bearish]
- 20 EMA: $364.07, about 1.6% above price and still falling. EMA10 ($358.37) is flat and sits on price. The EMA10 crossed below the EMA20 on Nov 5, and the EMA20 is acting as overhead resistance. [Bearish]
- MACD: Line -8.70, signal -10.60, so the histogram is about +1.9. The line crossed back above the signal on Nov 6 (-11.96 vs -12.06 flipped to -11.07 vs -11.86) and is rising. This is a bullish momentum turn, but it is deep below zero and reads as a relief bounce inside a downtrend. [Neutral]
- Bollinger Bands (20): Upper $397.36, lower $327.24, middle about $362. The bands are very wide after the Nov 5 gap. Price is in the lower half, below the midline, and has moved back inside the bands after the plunge toward the lower band. The midline (~$362) and EMA20 form a resistance cluster. [Bearish]
- CMF (20): -0.167, well below -0.05. It briefly improved to about -0.03 during the bounce and then dropped back, which shows sellers distributing into strength. [Distribution]
- ADX (14): 34.2, a strong trend, though it is rolling over from a 41.9 peak. −DI (33.7) is well above +DI (21.9), so bears are in control. The gap has narrowed from the Nov 5 extreme (58 vs 10), which shows the selling pressure is fading but not reversed. [Strong Trend - Bearish]
- Volume: 3.59M, far below the huge capitulation spike on the Nov 5 gap-down. The bounce from $340 to $360 came on declining volume, which suggests weak buying conviction. [Weak bounce / Bearish-leaning]
DIVERGENCES & TRENDS
- MA structure: Price ($358.16) is below the EMA20 ($364.07), SMA50 ($372.14) and SMA200 ($383.87). The SMA50 is already below the SMA200 (death-cross configuration), so the long-term trend is down. The SMA200 and SMA50 are both overhead resistance.
- Crossovers: The bearish EMA10/EMA20 cross on Nov 5 is still in force. The MACD bullish signal-line cross on Nov 6 is the only counter-signal.
- Divergence: RSI made a lower low (17) in the selloff, so there is no clean bullish divergence. The MACD histogram is turning up from deeply negative territory, which signals decelerating downside rather than a trend change.
- Trend: Price has made lower highs since the ~$410 peak around Oct 29-30. The Nov 5 gap-down broke the Oct 16-20 support area and the SMA50.
- VWAP: Price ($358.16) is at VWAP ($358.64) and marginally below it, which is neutral to slightly bearish.
- ADX: ADX is above 25 with −DI dominant, so the trend is still bearish. The falling ADX warns of consolidation.
CHART PATTERNS
- Bearish Flag / Pennant (continuation): After the sharp drop from ~$385 to ~$340, price has bounced and is coiling in a tight $358-$361 range under the falling EMA20. A breakdown below ~$356 would project a measured move toward $335-$340 or lower. A conservative 13-day target is near $350.
- Possible Bullish Double Bottom (reversal, unconfirmed): The lows at ~$340.80-$341.25 on Nov 5 form a base. Confirmation needs a close above ~$364-$372, which is the EMA20/SMA50 zone and the neckline equivalent. Until then it is only a possibility.
- Larger structure: The series of lower highs from Oct 29 and the break of the prior range support the bearish continuation read.
POTENTIAL SCENARIOS
- Scenario 1: Bearish Continuation Lower — The relief bounce fades under the EMA20/VWAP cluster and the flag resolves down, with −DI still dominant and CMF in distribution. Trigger: close below ~$356, then below $350. Target: $345-$350, with an extension to the $340 retest. Invalidation: daily close above $366 (EMA20 reclaimed). (45% probability)
- Scenario 2: Bullish Relief Rally / Double-Bottom Confirmation — The MACD bullish cross and the oversold bounce extend, and price squeezes toward the SMA50. Trigger: break and hold above $364. Target: $372-$378, with a possible extension to the $384 SMA200. Invalidation: loss of $350. (38% probability)
- Scenario 3: Neutral Range-Bound Chop — Price consolidates between $345 and $366 as ADX fades from 34. Trigger: no close beyond either edge. Target: $355-$362. Invalidation: a decisive close outside the $345-$366 range. (17% probability)
PRICE TARGETS
Timeframe: 13 days. The range width is about 10% of current price, as the 8-12% guidance for 14-21 days requires and a bit tighter for 13 days. Self-check: ($374.00 - $338.00) = $36.00, and $36 / $358.16 ≈ 10.1%. A 13-day ATR-based move is roughly 6.58 × √13 ≈ $23.7, so the width is consistent.
- Target Price: $350.00
- Expected Range: $338.00 to $374.00
- Key Levels: Support at $340.80, Resistance at $364.07
OVERALL BIAS
OVERALL BIAS: BEARISH - Price is below all major moving averages, −DI dominates with a strong ADX of 34, and CMF shows distribution. The bounce is on fading volume and is stalling under the EMA20, though the MACD cross and oversold RSI make conviction modest.
This is educational analysis and not financial advice.