WMT 13-day bearish forecast — Nov 8, 2026
- Bias: Bearish
- Timeframe: 13 days (made Nov 8, 2026, target date Nov 20, 2026)
- Price at analysis: $125.47
- Price target: $123.00
- Expected range: $118.50 – $129.00
- Result: Pending — graded after the close on Nov 20, 2026
Get a free AI analysis of WMT today
Analysis
TECHNICAL INDICATORS
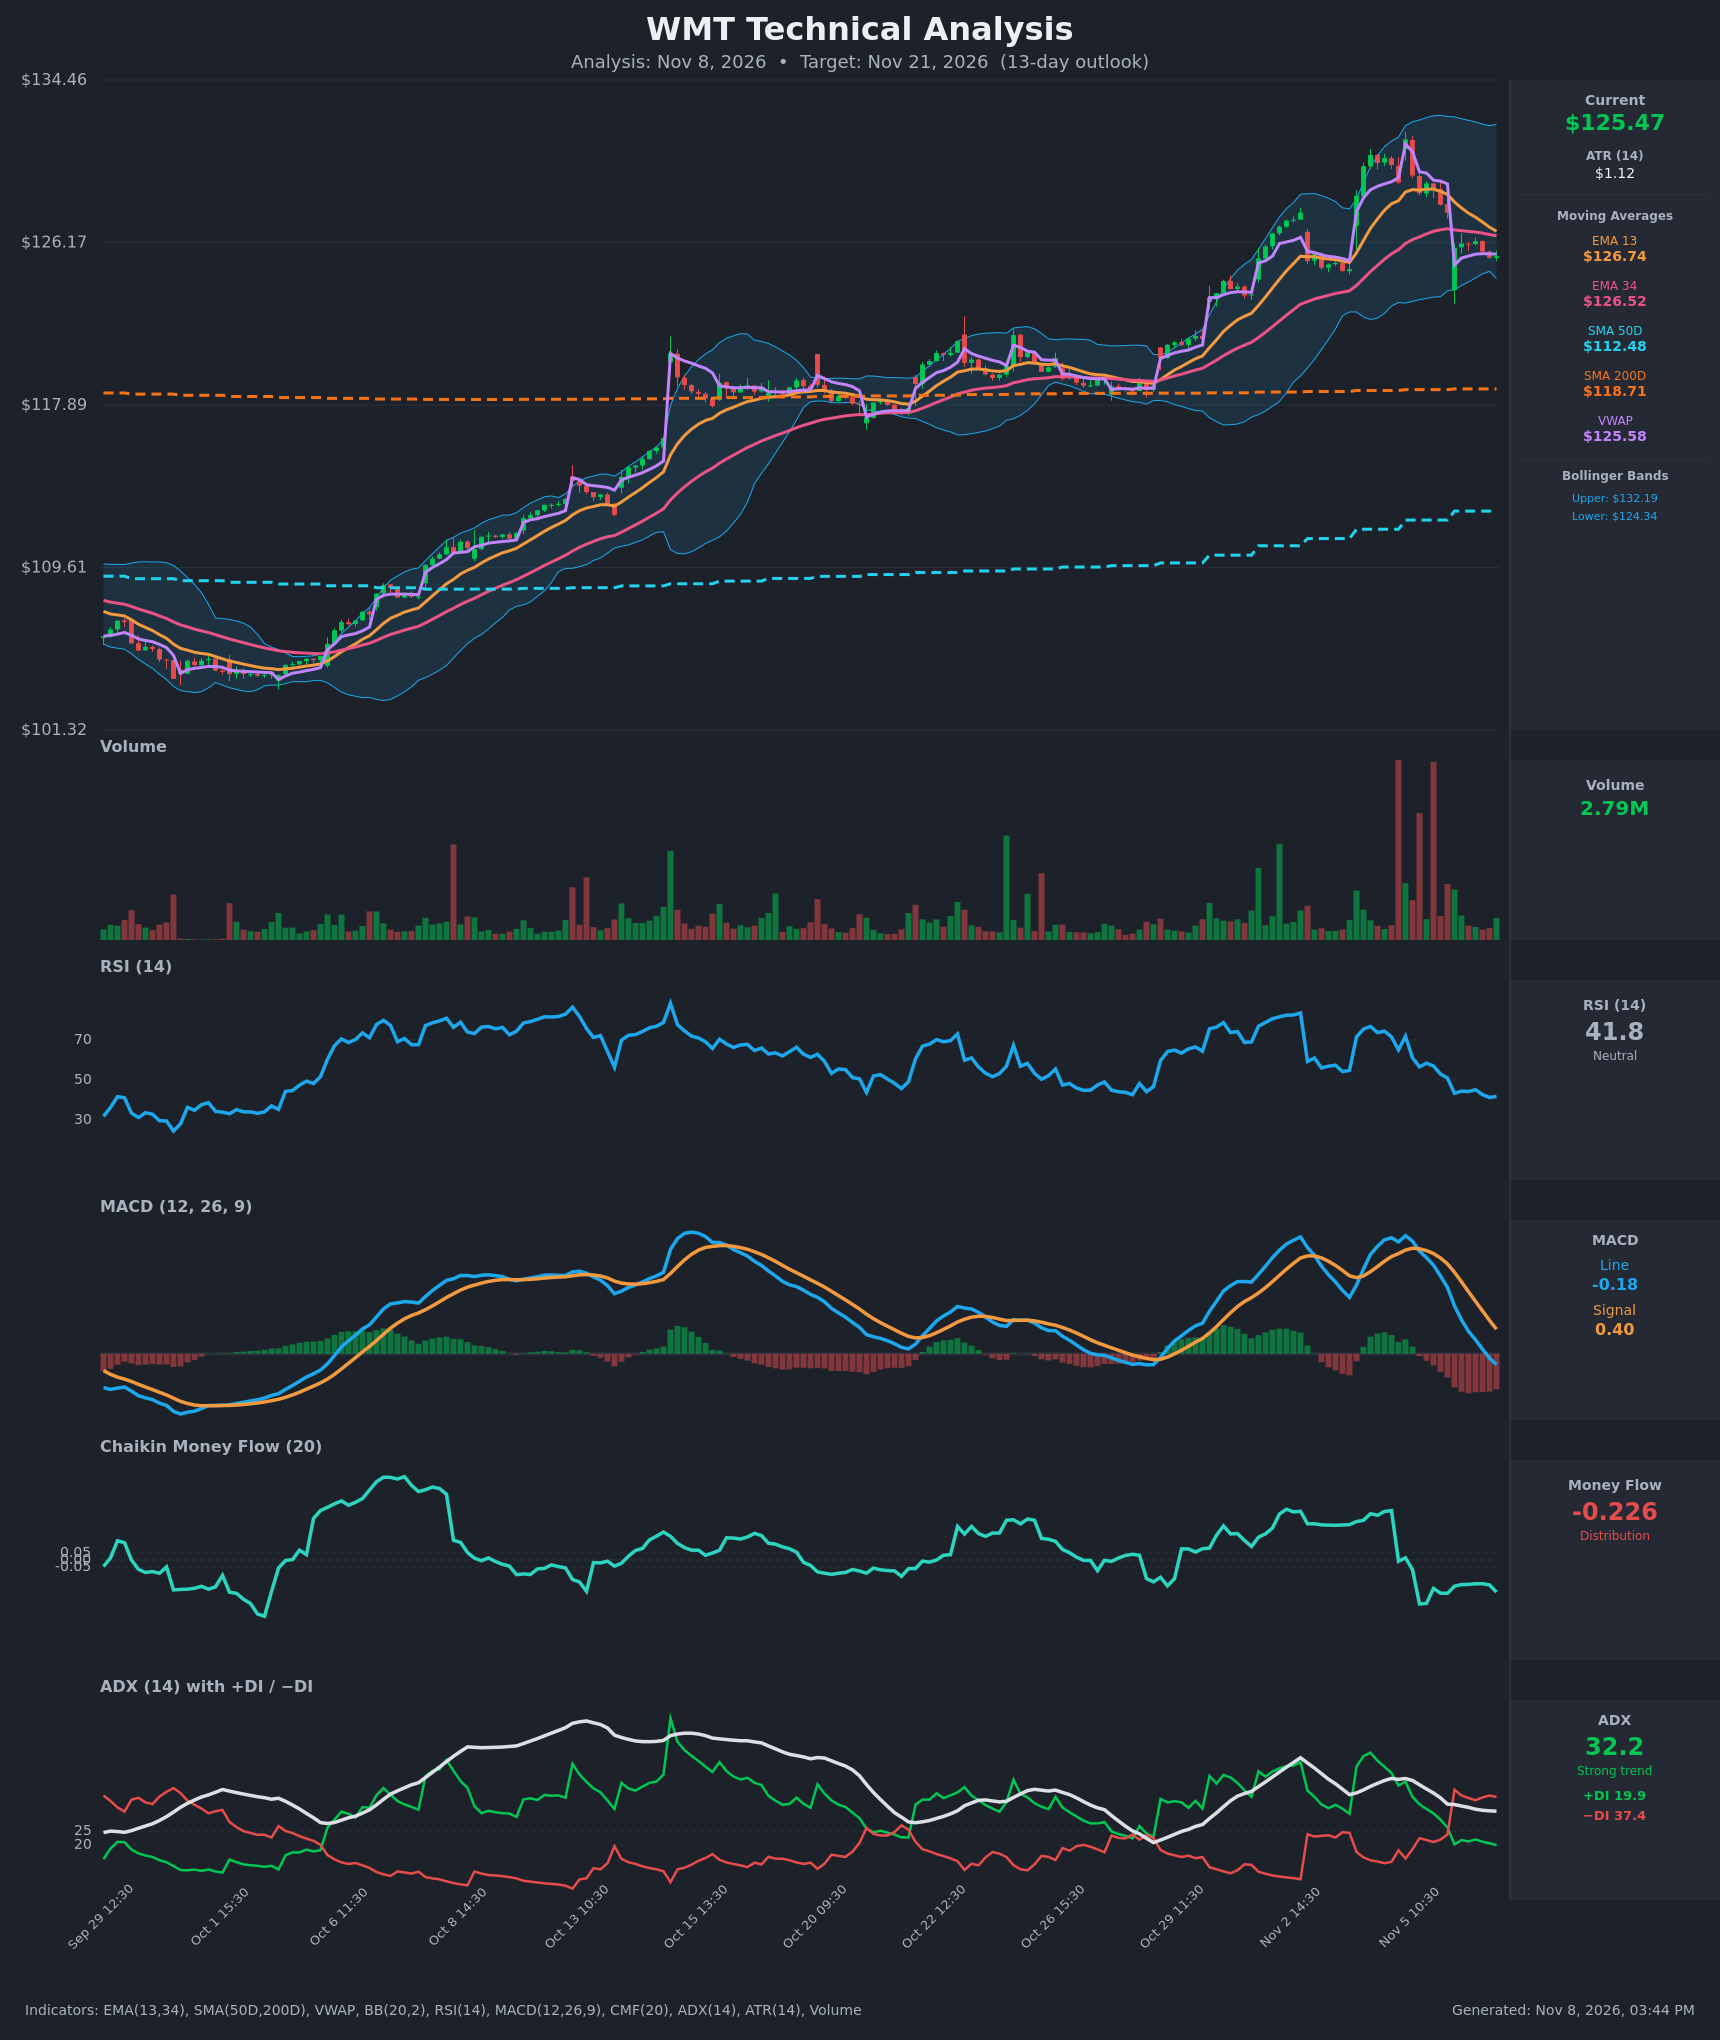
- RSI (14): 41.78, down from 71.9 on Nov 5 and sitting just under the midline. Momentum is falling but not yet oversold, so there is room for further downside. [Bearish]
- 20 EMA (13/34 EMAs provided): EMA13 is $126.74 and EMA34 is $126.52. Price at $125.47 is below both, so they act as overhead resistance. EMA13 has been falling toward EMA34 and is about to cross below it, which would be a bearish cross. [Bearish]
- MACD: The line (-0.18) crossed below the signal (0.40) on Nov 6 and has just dipped below zero. The histogram is deeply negative, about -0.58, and still expanding. [Bearish]
- Bollinger Bands (20): The bands run from $124.34 to $132.19. Price is hugging the lower band after a sharp drop from the upper band, so the bands are wide and the squeeze is over. A walk down the lower band is possible, but a bounce toward the $128 midline is also possible. [Neutral]
- CMF (20): -0.226, well below -0.05. It fell sharply from positive readings in early November, which points to heavy distribution. [Distribution]
- ADX (14): 32.2 (above 25), but it has fallen from 44 as the prior uptrend faded. −DI (37.4) is far above +DI (19.9), and the DI cross on Nov 6 flipped control to the bears. [Strong Trend – Bearish]
- Volume: 2.79M on the latest bar, with very large red volume spikes on the Nov 5–6 breakdown. This is high-volume selling (distribution), and the rebound attempts since then have come on lighter volume. [Bearish]
Other levels:
- Price is just below VWAP ($125.58).
- Price is far above SMA50 ($112.48) and SMA200 ($118.71). The long-term trend is still up, but price is extended above both averages, so there is mean-reversion room to the downside.
DIVERGENCES & TRENDS
- There is no clear bullish divergence. RSI and MACD both made lower highs while price pushed to the $131 area, a mild bearish divergence that resolved with the gap-down.
- MACD crossed bearishly, and the DI lines flipped to −DI dominance with a wide spread.
- CMF dropped from healthy positive readings to -0.23. Money flow turned negative at the highs, confirming distribution.
- The EMA13/EMA34 spread has shrunk from about +2.5 to about +0.2. A bearish EMA cross is imminent.
- SMA50 is above SMA200, so there is no death cross. The golden-cross structure is intact, which gives long-term support near $118.7.
- ADX is falling from its peak. The trend of the prior advance is exhausted, and the current bearish trend is only starting to build.
CHART PATTERNS
- Bearish Double Top / Head and Shoulders (loosely): Price has peaked twice, around $131.4 on Nov 5 and near $130 earlier in the week, followed by a sharp break. The "neckline" area near $126 has been lost. The measured move targets the high-$120s to low-$120s.
- Bearish Flag / Pennant: The small, shallow consolidation around $125.4–$126.2 after the gap-down looks like a bearish flag. A break below $125 would project a move of about $5–6 (the pole is roughly $5.5), toward $120–$121.
- The large gap-down also leaves an open "gap fill" zone, between $126 and $129, that may cap rallies.
POTENTIAL SCENARIOS
- Scenario 1: Bearish Flag Breakdown — Price fails at the EMA13/34 cluster and VWAP, then breaks the lower Bollinger Band and the flag low. Trigger: a close below $124.30 on elevated volume. Target: $121.00–$123.00, with an extension toward $118.70 (SMA200D). Invalidation: a close above $127.00 (above the EMAs). (50% probability)
- Scenario 2: Bullish Relief Bounce — Oversold-ish conditions near the lower band and the strong long-term uptrend trigger a dead-cat bounce toward the Bollinger midline. Trigger: a reclaim of $126.75 with rising volume and a CMF turn upward. Target: $128.50–$129.50. Invalidation: a rejection at $127 and a close back below $125. (30% probability)
- Scenario 3: Neutral Consolidation — Price chops between $123.50 and $127.00 as the bearish momentum digests. Trigger: ADX continues to fall and RSI flattens near 40–45. Target: $125–$126. Invalidation: a close outside $123.50–$127.00. (20% probability)
PRICE TARGETS
For the 13-day horizon (to Nov 21, 2026):
- Target Price: $123.00
- Expected Range: $118.50 to $129.00. This is a $10.50 width, or about 8.4% of the current price, which is in line with the 13-day timeframe.
- Key Levels: Support at $122.50 (below the Nov 6 gap-day low area; next at $118.71 SMA200D), Resistance at $126.74 (EMA13, then $128.50)
OVERALL BIAS
OVERALL BIAS: BEARISH - Price has broken down below the EMAs on heavy volume. MACD and DI crossed bearishly, CMF shows strong distribution, and RSI still has room to fall. The extended gap above SMA50 and SMA200 favors a drift toward $123.
This is educational analysis and not financial advice.