XLE 13-day bearish forecast — Nov 8, 2026
- Bias: Bearish
- Timeframe: 13 days (made Nov 8, 2026, target date Nov 20, 2026)
- Price at analysis: $61.64
- Price target: $60.50
- Expected range: $58.50 – $63.50
- Result: Pending — graded after the close on Nov 20, 2026
Get a free AI analysis of XLE today
Analysis
TECHNICAL INDICATORS
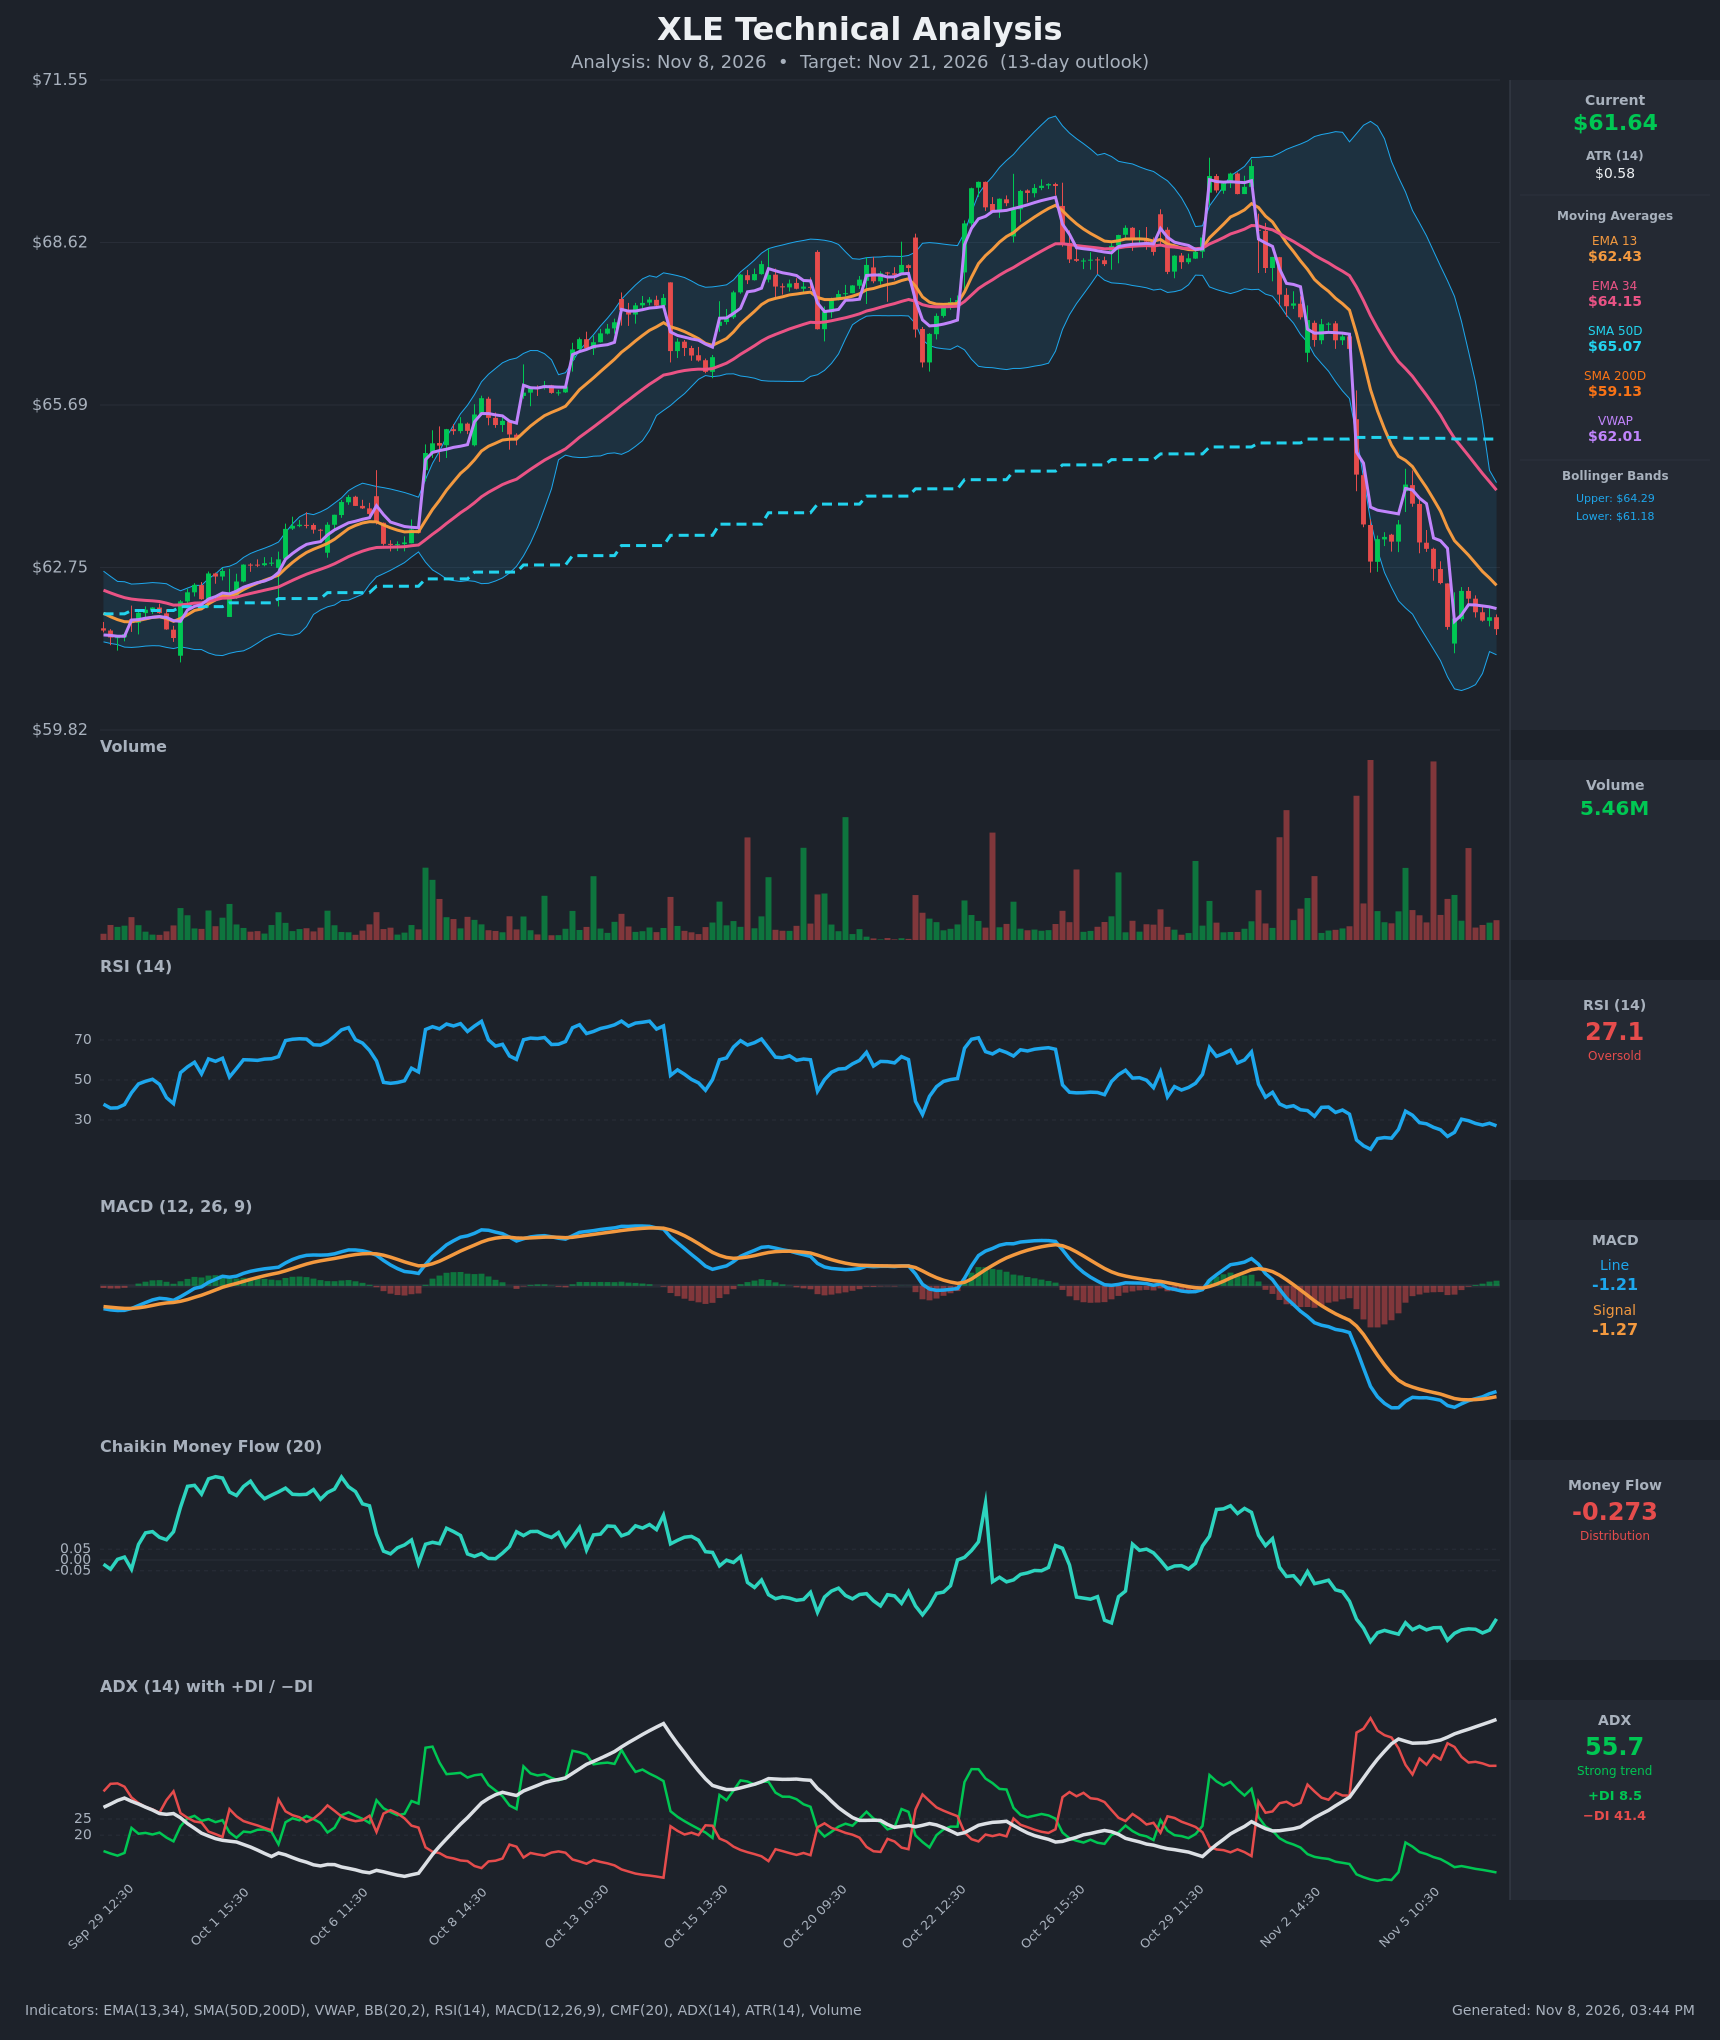
- RSI (14): 27.08, in oversold territory. It has been below 30 for most of the last 15 bars, with a low of 21.8 on Nov 5 15:30. Each bounce (34.4, 30.4) failed to hold above 30, so momentum is still pointed down, though the reading is stretched. [Bearish]
- 20 EMA: The provided short EMA is the EMA 13 at $62.43, with the EMA 34 at $64.15. Price at $61.64 is below both, and EMA13 is below EMA34 and still falling, so both act as overhead resistance. [Bearish]
- MACD: Line -1.214 is just above signal -1.273, a fresh bullish crossover around Nov 6 14:30. The histogram is slightly positive (+0.06) after a deep negative stretch, but both lines are far below zero. This is an early, weak momentum stabilization, not a trend reversal. [Neutral]
- Bollinger Bands (20): Upper $64.29, lower $61.18. Price at $61.64 is hugging the lower band after walking it lower, and the bands are widely expanded. This shows an extended move that is prone to a relief bounce, but trends can keep riding the band. [Bearish]
- CMF (20): -0.273, well below -0.05. It has been persistently negative, between -0.27 and -0.37 for the last 15 bars, so selling pressure dominates. There is no sign of accumulation yet. [Distribution]
- ADX (14): 55.7 and rising, a very strong trend. −DI (41.4) is far above +DI (8.5), so bears are firmly in control. Readings this high can signal late-stage trend exhaustion, but no DI convergence has started. [Strong Trend – Bearish]
- Volume: 5.46M on the latest bar, well below the large red-volume spikes during the breakdown. Selling volume is fading on the recent consolidation. That could mean selling exhaustion or just a pause. [Neutral / Fading Selling Pressure]
DIVERGENCES & TRENDS
- Moving averages: EMA13 crossed below EMA34 well before the window, and both are declining. The SMA50D ($65.07) is still above the SMA200D ($59.13), so there is no death cross yet. Price has lost the SMA50D and sits $2.51 above the SMA200D, which is the next major long-term support.
- VWAP: Price ($61.64) is below VWAP ($62.01), which shows sellers still control the session average.
- MACD: The bullish line/signal crossover is the only improving signal. The MACD line has risen from -1.40 to -1.21 while price printed roughly equal lows, which is a mild bullish momentum divergence.
- RSI: Price made lows near $61.64–$61.68, and RSI is higher now (27 vs 21.8). That is a minor bullish divergence, but RSI has not recovered above 30.
- CMF and ADX: CMF has not confirmed any bottom and sits near its lows. ADX keeps climbing with −DI dominant, so the trend is intact.
- Overall: The strong trend and distribution readings outweigh the minor oversold divergences.
CHART PATTERNS
- Bearish Double Top (reference diagram): The Oct 22 and Oct 29 highs (roughly the $69–70 area) formed a double top. The subsequent neckline break led to the steep decline. The classic measured target has largely been achieved already.
- Bearish Flag/Pennant (continuation): The tight, low-range, slightly sideways drift over the last ~10 bars after the sharp drop resembles a small bear flag. A break below ~$61.20 (the lower Bollinger Band and recent lows) would imply a continuation toward the SMA200D at $59.13 and slightly below. The flagpole implies more downside than that, but the rising SMA200D is likely to slow it.
- Counter-risk: A stretched, oversold, band-hugging decline could produce a relief rally toward the EMA13 ($62.43) and VWAP ($62.01) before the next leg down.
POTENTIAL SCENARIOS
- Scenario 1: Bearish Trend Continuation to SMA200D — The strong downtrend (ADX 55.7, −DI 41.4) resumes after a brief consolidation, and a bear-flag breakdown heads to long-term support. Trigger: Hourly close below $61.18 (lower BB) and the recent lows near $61.00. Target: $59.50–$60.50, with an extension to the SMA200D at $59.13. Invalidation: Sustained close above $63.00 (EMA13 and VWAP reclaimed). (47% probability)
- Scenario 2: Bullish Oversold Relief Bounce — RSI below 30, the MACD bullish cross and price at the lower band trigger short covering and mean reversion. Trigger: Close above $62.45 (EMA13) with improving CMF. Target: $63.00–$64.15 (EMA34 and the mid/upper Bollinger Band area). Invalidation: Failure at $62.43–$63 followed by a break below $61.00. (38% probability)
- Scenario 3: Neutral Base-Building Range — Price chops between $60.50 and $62.50 as selling exhausts but buyers lack conviction. Trigger: Low-volume, narrow-range trading with ADX rolling over. Target: $61.00–$62.20. Invalidation: Close outside $60.00–$63.00. (15% probability)
PRICE TARGETS
Timeframe: 13 days (to Nov 21, 2026). Calculation: range width = $63.50 − $58.50 = $5.00, which is 8.1% of the current price ($61.64). That fits the guidance for this timeframe and is more than 2x a 2–3 day range. The ATR of $0.58 implies roughly ±$2.1 for 13 days on a random-walk basis (0.58 × √13), which is consistent with the range.
- Target Price: $60.50 (for 13 days)
- Expected Range: $58.50 to $63.50
- Key Levels: Support at $59.13 (SMA200D), Resistance at $62.43 (EMA13)
OVERALL BIAS
OVERALL BIAS: BEARISH - The strong, rising downtrend (ADX 55.7 with −DI 41.4 vs +DI 8.5), persistent distribution (CMF -0.27), and price below all key short- and medium-term averages and VWAP outweigh the oversold RSI and early MACD cross. Expect continued weakness toward the SMA200D area, with a relief bounce toward $62.40 likely to be sold into.
This is educational analysis and not financial advice.