BAC 20-day bearish forecast — Nov 8, 2026
- Bias: Bearish
- Timeframe: 20 days (made Nov 8, 2026, target date Nov 27, 2026)
- Price at analysis: $49.42
- Price target: $48.20
- Expected range: $46.00 – $51.00
- Result: Pending — graded after the close on Nov 27, 2026
Get a free AI analysis of BAC today
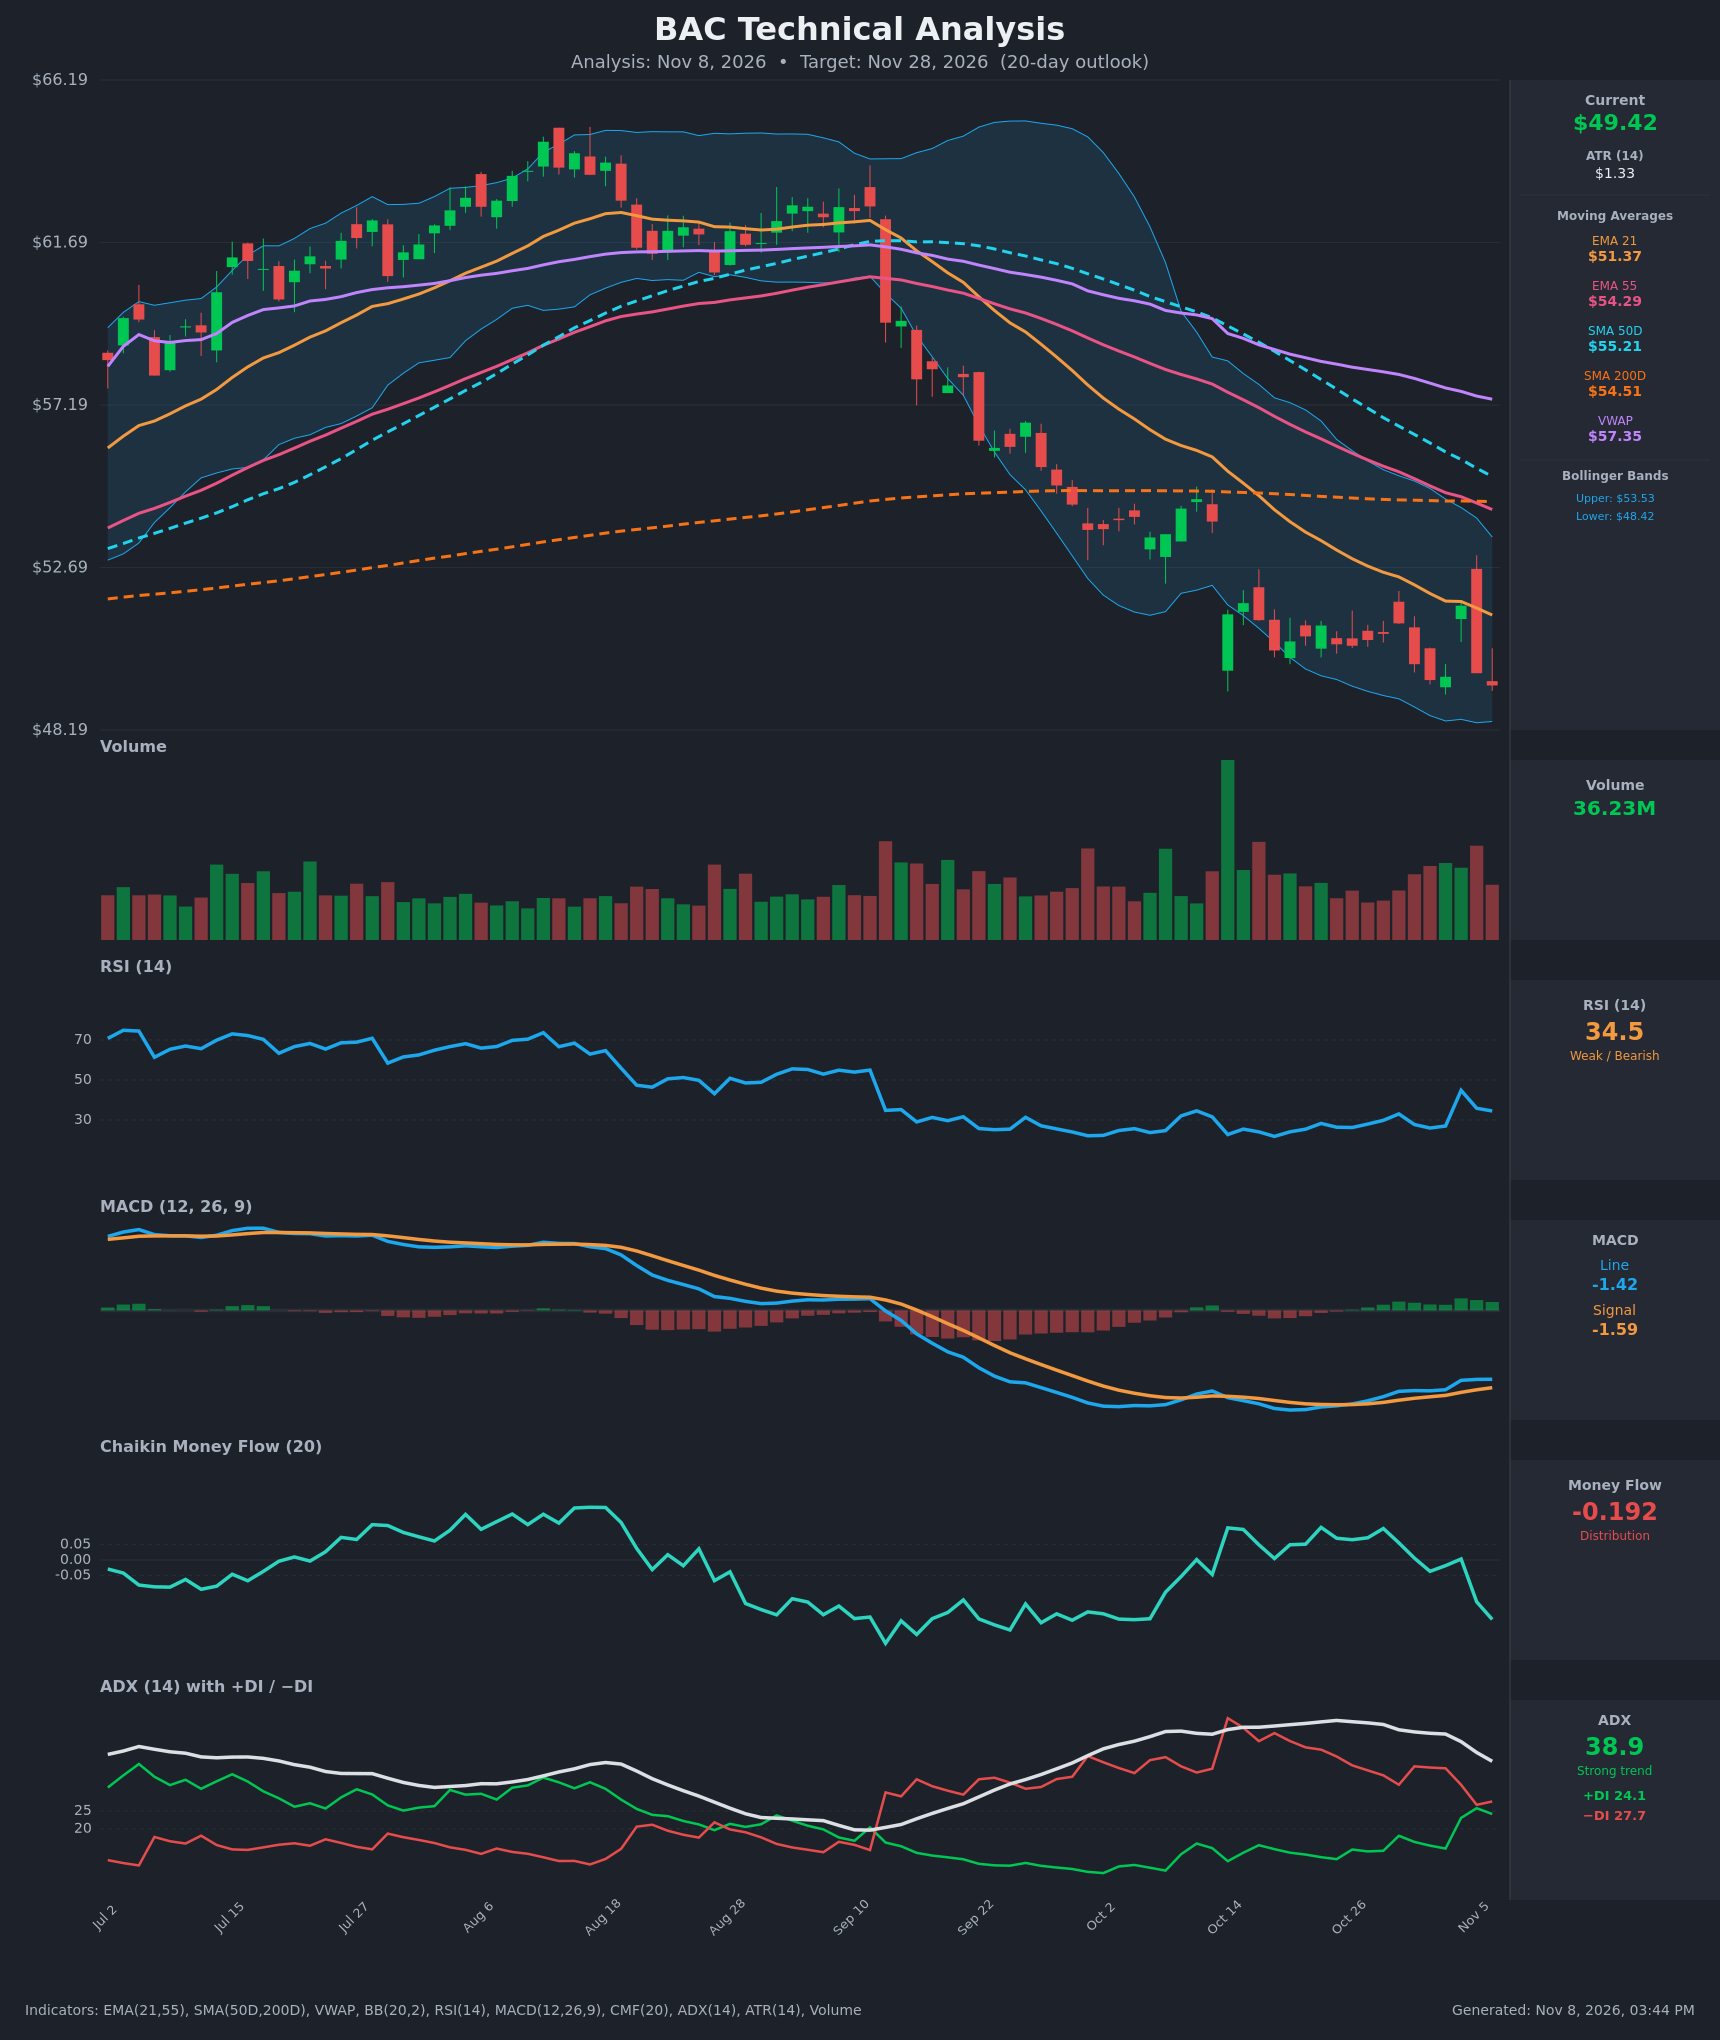
Analysis
TECHNICAL INDICATORS
- RSI (14): 34.52, near oversold but not yet below 30. It has bounced off the 21.8 low of Oct 19 and keeps making higher lows. The Nov 4 spike to 44.8 failed and RSI rolled back down to the mid-30s. [Neutral]
- 20 EMA (21 EMA used): $51.37, with price ($49.42) about 3.8% below it. The EMA is still sloping down, and price was rejected near it on Nov 4 ($51.63 close, then back to $49.76). It acts as resistance. [Bearish]
- MACD: Line -1.415 is above Signal -1.589, a bullish crossover that happened around Oct 26-27. The histogram is positive (+0.17) but has stopped expanding. Both lines are deep below zero, so this is a counter-trend momentum improvement, not a trend reversal. [Neutral]
- Bollinger Bands (20): Upper $53.53, lower $48.42. Price sits in the lower quarter of the band, about $1.00 above the lower band. The bands are contracting after a big expansion, and price has been walking the lower half. A close below $48.42 would signal continuation. [Bearish]
- CMF (20): -0.192, clear distribution. It has fallen sharply from +0.105 on Oct 22 and is making a fresh low even as price holds near its prior lows. Sellers are in control on the latest leg down. [Distribution]
- ADX (14): 38.9 (falling from a peak of ~50), with -DI 27.7 above +DI 24.1. The trend is strong, but the gap between the DIs has narrowed sharply from 47/14 in mid-October. Bears are still on top, but their dominance is fading. A falling ADX with converging DIs points to a maturing downtrend. [Strong Trend – Bearish, weakening]
- Volume: 36.23M, elevated. The Oct 14 capitulation spike was followed by a bounce that failed, and recent selling days (Nov 4 reversal, Nov 6 decline) came on heavy volume. Price is below VWAP ($57.35) by a wide margin. [Selling pressure / distribution]
DIVERGENCES & TRENDS
- Bullish divergence (momentum): Price is retesting its Oct 14-Nov 3 lows near $49.4-49.6. RSI (34.5 vs 21.8 in Oct) and MACD (-1.42 vs -2.05) are far higher than at the earlier lows, so downside momentum is waning.
- CMF disagrees: CMF is at -0.192, below its earlier readings, which is a bearish divergence against the momentum oscillators. Volume flow does not confirm a bottom.
- Moving-average structure:
- The death cross has already happened. SMA50D ($55.21) is now above SMA200D ($54.51) only marginally and still converging, and EMA21 < EMA55 < SMA50D.
- Price is below every moving average and below VWAP, which is a textbook downtrend stack.
- The MA cluster at $54-55 is far overhead and unlikely to be tested in 20 days.
- Trend break: The Nov 4 bounce to $51.63 was fully retraced within a day. This rejection near the EMA21 is a lower high.
CHART PATTERNS
- Descending Triangle (bearish continuation): Flat support at roughly $49.4-49.6 has been tested several times (Oct 14, Nov 3, Nov 6), while rallies make lower highs ($51.1 → $51.6 rejected under a falling EMA21). A decisive close below ~$49.4 would confirm the breakdown. The measured move is the triangle height (~$3, from ~$52.5 to ~$49.5), giving a target near $46.5.
- Bullish Triple Bottom / Double Bottom (alternative read): The repeated lows near $49.5 with higher RSI lows could also be read as a triple bottom. It would only be confirmed by a close above ~$51.6-52.5, which has not happened.
- Given the failed Nov 4 bounce and CMF deterioration, the descending triangle carries slightly more weight.
POTENTIAL SCENARIOS
- Scenario 1: Bearish Support Breakdown — Price fails to hold the $49.4-49.5 floor and closes below the lower Bollinger Band as distribution continues. Trigger: daily close below $48.40 on above-average volume. Target: $46.50-$47.00 (the triangle measured move and roughly 2 ATR below). Invalidation: daily close above $51.40 (EMA21). (45% probability)
- Scenario 2: Bullish Oversold Bounce — Higher RSI/MACD lows and an oversold lower-band test spark a mean-reversion rally toward the EMA21 and upper band. Trigger: RSI reclaims 40 and price closes above $51.40-51.60. Target: $52.50-$53.50 (upper BB). Invalidation: close below $48.40. (40% probability)
- Scenario 3: Neutral Range Chop — Price oscillates between $48.40 and $51.40 as ADX decays and the DIs converge. Trigger: no close beyond either boundary. Target: $49-50.50. Invalidation: close outside $48.40-$51.40. (15% probability)
PRICE TARGETS
- Target Price: $48.20 (20-day horizon, slightly below current price)
- Expected Range: $46.00 to $51.00 (width $5.00, about 10.1% of current price, in line with the 14-21 day guidance)
- Key Levels: Support at $48.40 (lower Bollinger Band / recent lows), Resistance at $51.37 (EMA21)
OVERALL BIAS
OVERALL BIAS: BEARISH - Price is below all moving averages and VWAP, −DI leads +DI with a strong ADX near 39, and CMF is at a fresh low of -0.192. Together with a failed bounce at the EMA21 and a descending-triangle structure, these outweigh the improving MACD and RSI, although the oversold bounce risk is significant and conviction is modest.
This is educational analysis and not financial advice.