BB 20-day bullish forecast — Nov 8, 2026
- Bias: Bullish
- Timeframe: 20 days (made Nov 8, 2026, target date Nov 27, 2026)
- Price at analysis: $8.74
- Price target: $9.00
- Expected range: $8.30 – $9.35
- Result: Pending — graded after the close on Nov 27, 2026
Get a free AI analysis of BB today
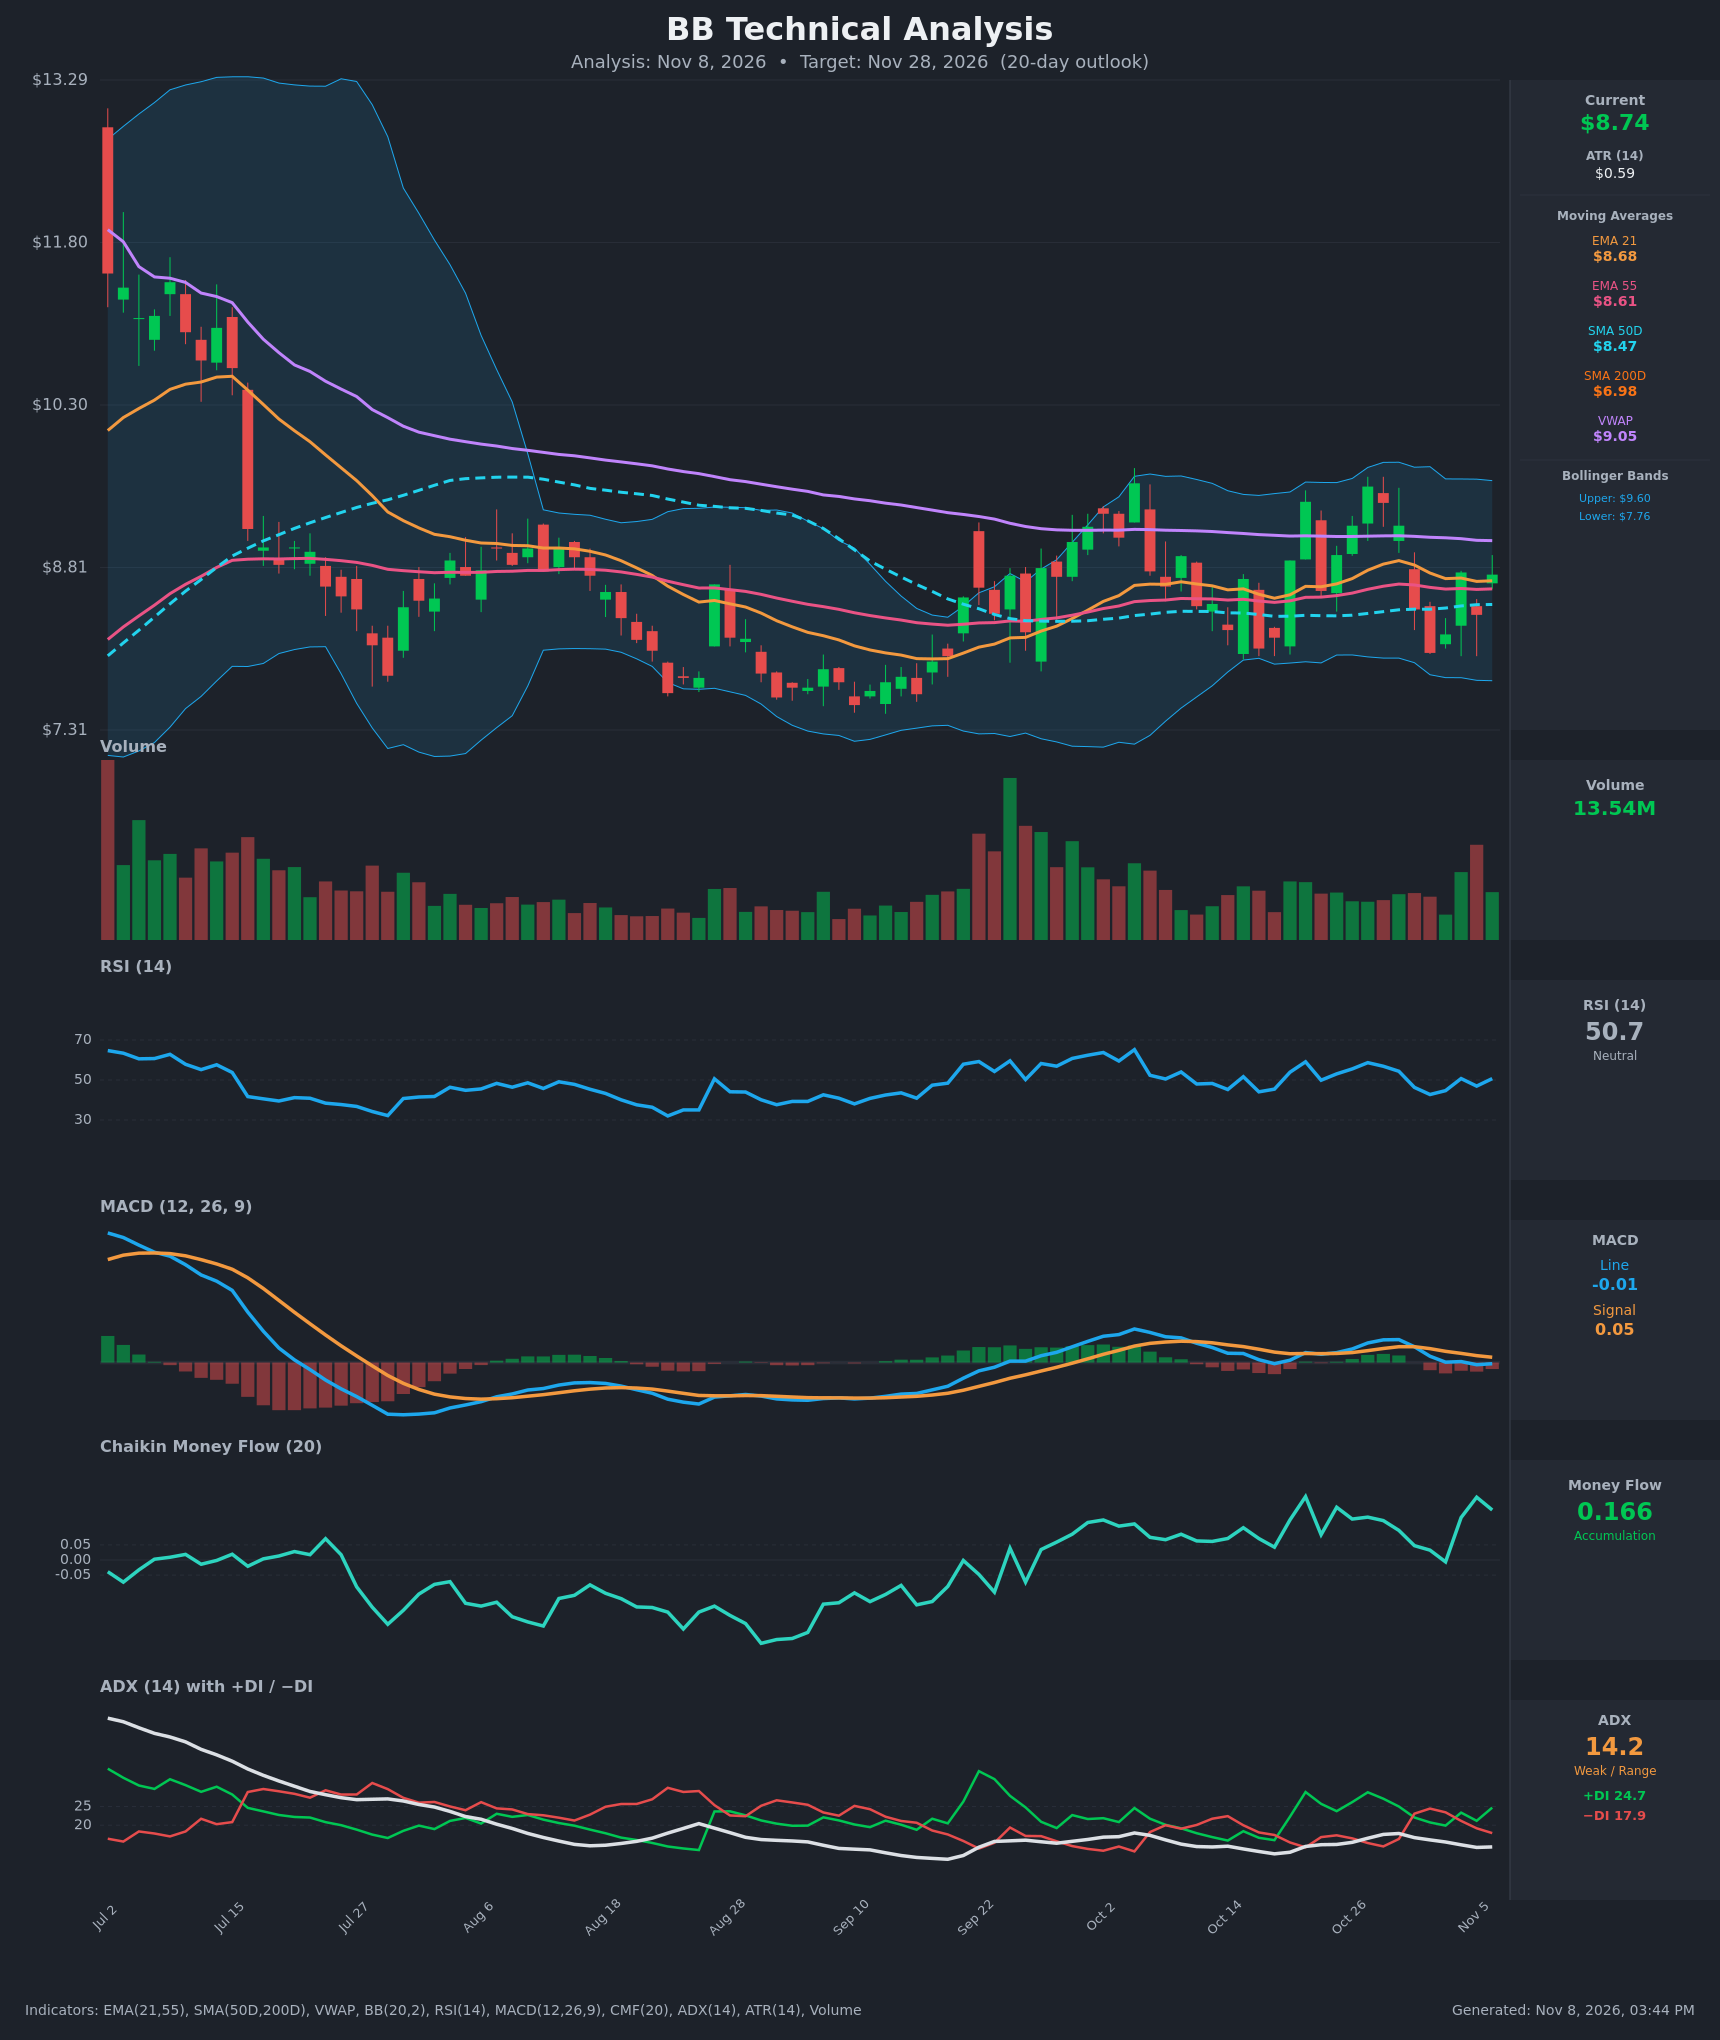
Analysis
TECHNICAL INDICATORS
- RSI (14): 50.69, dead center of the range. It has oscillated between ~43 and ~59 for two weeks, with no overbought or oversold signal and no directional momentum. [Neutral]
- 20 EMA: EMA 21 is $8.68 and EMA 55 is $8.61. Price at $8.74 is just above both, so they act as near-term support, but the cushion is only about 0.7%. EMA21 is above EMA55 with a slowly narrowing gap, and the stack of 8.68 / 8.61 / 8.47 (SMA50) is intact. [Bullish]
- MACD: Line -0.010 is below signal 0.046, a bearish crossover that happened around Oct 30. The histogram is slightly negative (about -0.056) and has narrowed from -0.078 yesterday. Both lines are drifting toward zero, so momentum is fading rather than accelerating. [Bearish]
- Bollinger Bands (20): Upper $9.60, lower $7.76, midline about $8.68. Price sits right at the midline. The bands are narrow compared with the July–August expansion, which signals compressed volatility and a possible breakout setup. The Oct 27 rally stalled just under the upper band. [Neutral]
- CMF (20): 0.166, well above +0.05 and near the recent high. Accumulation has been sustained since late September, even while price went sideways. That suggests buyers are absorbing supply. [Accumulation]
- ADX (14): 14.2 and drifting lower, below the 20 threshold, so there is no trend and the market is range-bound. +DI (24.7) is above −DI (17.9), so the bulls have a modest edge. [Weak Trend, Bullish lean]
- Volume: 13.54M, roughly average and not showing a decisive expansion. Heavy-volume bars in late September came with the upside break from the base, while recent selling days have shown no volume surge. [Neutral to mildly Bullish]
Other levels: price is above SMA50 ($8.47) and well above SMA200 ($6.98). SMA50 is above SMA200, so the golden-cross state is intact and the long-term trend is up. Price is below VWAP ($9.05), which marks overhead supply.
DIVERGENCES & TRENDS
- CMF vs. price: CMF is making higher readings (0.166) while price is flat to slightly lower since Oct 27. This is a mild bullish divergence, showing accumulation under a stalled price.
- MACD vs. price: MACD has rolled over from its Oct 29 peak (0.199) and sits below its signal line. Price has made a lower high (9.55 → 9.19 → 8.74 on closes), so short-term momentum is weaker. The histogram is narrowing, which suggests the bearish impulse is exhausting.
- Moving averages: There have been no EMA crossovers. EMA21 has been above EMA55 since mid-October, and the golden cross state (SMA50 > SMA200) is intact.
- DI: +DI regained the upper hand on Nov 4 after −DI led Oct 30–Nov 3. ADX is still far too low to confirm a trend.
- Range structure: Since mid-September price has traded roughly $7.9–$9.6, with higher lows from the base at ~$7.7–$7.9.
CHART PATTERNS
- Primary read: a consolidation or rectangle between ~$8.0 and ~$9.55, following the September breakout from a base. Weak ADX and narrow Bollinger Bands fit this. The pattern most resembling the reference diagram is the symmetrical triangle or ascending-triangle family, because of the higher lows against a capped ceiling near $9.4–$9.6.
- Significance: the prior move up from the $7.7 base makes a bullish continuation more likely than a reversal. The measured target for a break above $9.60 is about $10.50–$11.00 (the range height of ~$1.6 added to the breakout). That is beyond the 20-day horizon.
- Bearish alternative: repeated failures near $9.4–$9.55 could develop into a double or triple top (Oct 21 and Oct 27 peaks). A close below $8.02 (the Nov 2 low) would confirm a break toward $7.76.
POTENTIAL SCENARIOS
- Scenario 1: Bullish Range Push to VWAP — CMF accumulation, a price-above-EMA stack, and +DI above −DI favor a gradual grind higher as the MACD histogram flattens and turns up. Trigger: a daily close above $9.05 (VWAP) with volume above 15M, and MACD crossing above signal. Target: $9.00–$9.55. Invalidation: a close below $8.47 (SMA50). (45% probability)
- Scenario 2: Neutral Range Chop — Weak ADX and compressed bands keep price oscillating around the $8.68 midline. Trigger: failure to clear $9.05 and a hold above $8.47. Target: $8.40–$9.00. Invalidation: a daily close above $9.60 or below $8.02. (33% probability)
- Scenario 3: Bearish Rollover — The MACD bearish cross and rejection at VWAP and the Oct 27 high lead to a break of support. Trigger: a close below $8.47, then $8.02, on rising volume with −DI crossing above +DI. Target: $7.76–$8.02. Invalidation: a reclaim of $8.90 on a close. (22% probability)
PRICE TARGETS
- Target Price: $9.00 (20-day horizon)
- Expected Range: $8.30 to $9.35. Width $1.05, about 12% of the current price, consistent with the 14-21 day guidance.
- Key Levels: Support at $8.47 (SMA50, with EMA55 at $8.61 above it), Resistance at $9.05 (VWAP, then $9.55–$9.60 range highs)
OVERALL BIAS
OVERALL BIAS: BULLISH - Sustained accumulation (CMF 0.166), a bullish-stacked MA structure above a rising SMA200, and +DI over −DI outweigh the fading MACD and weak ADX. Conviction is modest, and a move toward VWAP at ~$9.00 is the most probable outcome while the $8.47 support holds.
This is educational analysis and not financial advice.