IWM 20-day bearish forecast — Nov 8, 2026
- Bias: Bearish
- Timeframe: 20 days (made Nov 8, 2026, target date Nov 27, 2026)
- Price at analysis: $273.67
- Price target: $268.50
- Expected range: $257.00 – $283.50
- Result: Pending — graded after the close on Nov 27, 2026
Get a free AI analysis of IWM today
Analysis
TECHNICAL INDICATORS
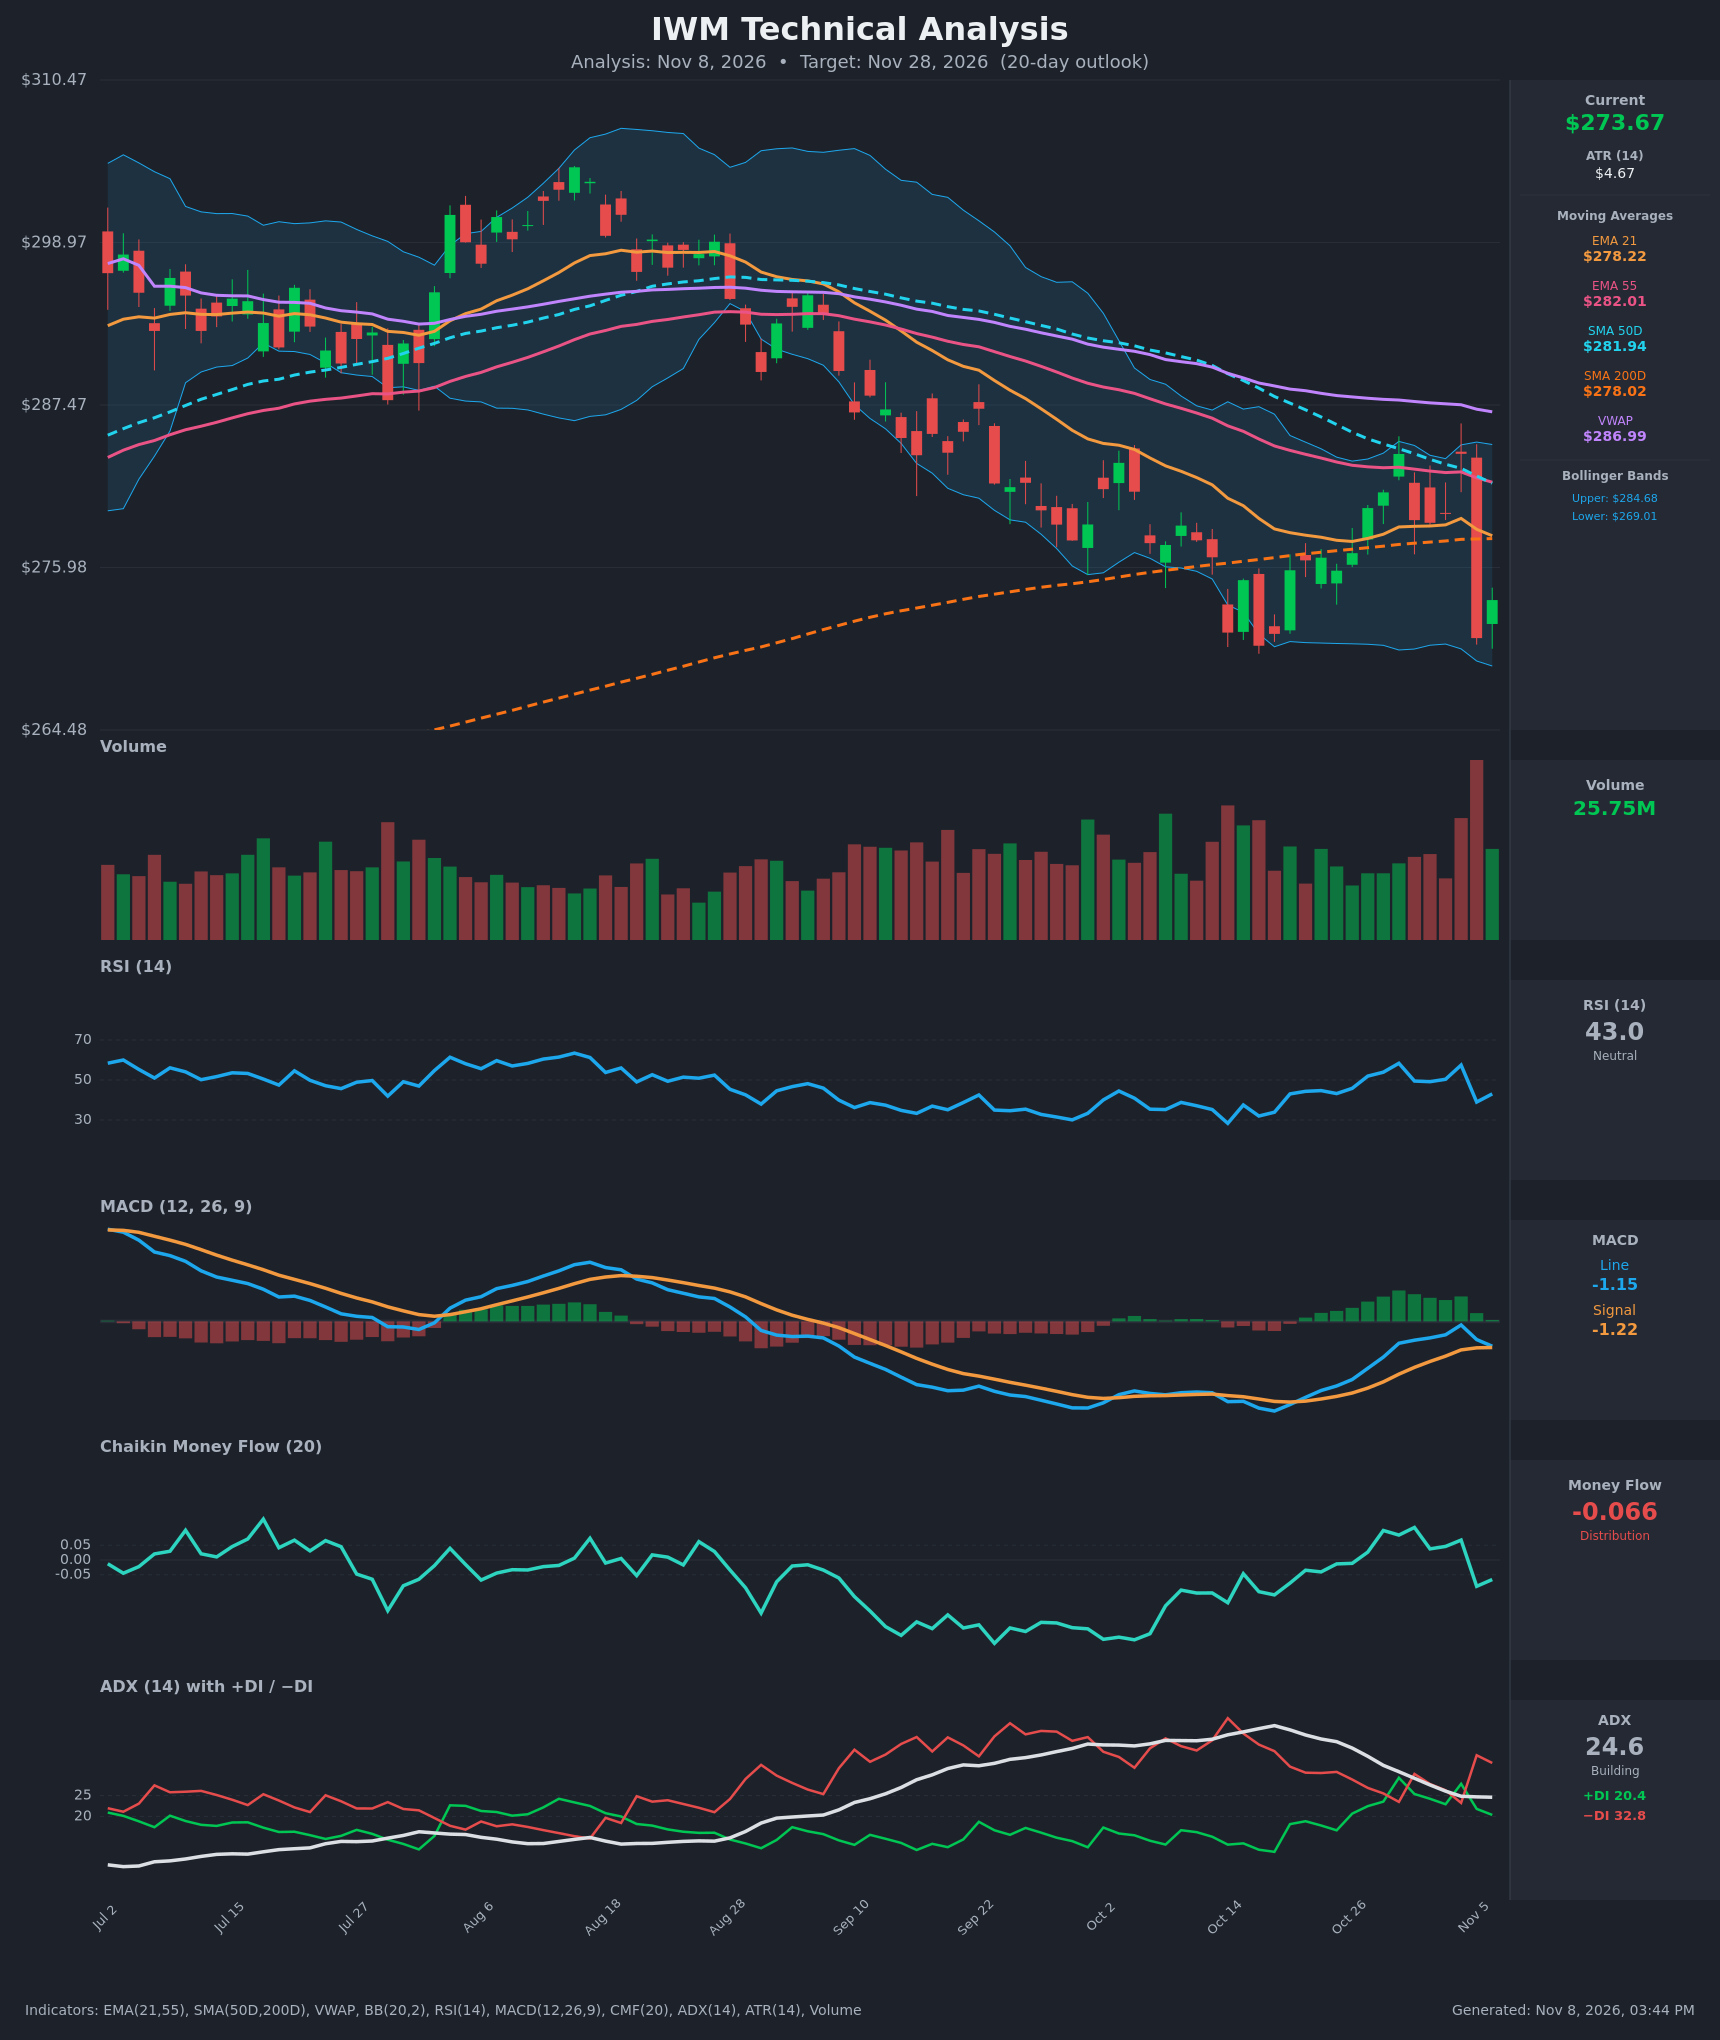
- RSI (14): 43.05, below the neutral 50 line and rebounding slightly from 39.0 on Nov 5. The reading is not oversold. It peaked at 58.4 on Oct 29 and has made lower highs since, so momentum is fading. [Bearish]
- 20 EMA: The EMA21 is $278.22 and price at $273.67 is below it, so it acts as resistance. The EMA21 is also below the EMA55 ($282.01) and both are sloping down, a bearish stack. [Bearish]
- MACD: Line -1.155 versus signal -1.216, a marginal positive histogram of about +0.06. The line has just slipped back toward the signal after peaking at -0.167 on Nov 4. The histogram is collapsing and both lines remain below zero, so the signal is weak. A bearish re-cross looks more likely than a push higher. [Neutral]
- Bollinger Bands (20): Upper $284.68, lower $269.01, midline about $276.85. Price is in the lower half, about $4.65 above the lower band. The Nov 5 candle plunged from the upper band to the lower band, so the bands are not contracting and volatility is elevated. The failure at the upper band on Oct 29 and Nov 4 shows sellers defending it. [Bearish]
- CMF (20): -0.066, below the -0.05 threshold. It turned from slightly positive (+0.068 on Nov 4) to negative after the Nov 5 high-volume sell-off. [Distribution]
- ADX (14): 24.6, near the 25 trend threshold but falling from 41.7 on Oct 19. −DI (32.8) is well above +DI (20.4), so bears control. The trend is still bearish but losing intensity. [Moderate Trend – Bearish]
- Volume: 25.75M. The largest volume spike on the chart came on the Nov 5 red candle (about -4.6%). That is heavy distribution and a bearish reversal from the upper band, and the follow-through green candle is on lower volume. [Bearish]
DIVERGENCES & TRENDS
- Moving averages: Price is below the EMA21, EMA55, SMA50D ($281.94), SMA200D ($278.02) and VWAP ($286.99). The SMA50D is falling toward the SMA200D (a gap of only $3.9), so a death cross is likely in the coming days or weeks. The EMA21 has been below the EMA55 since early September.
- Price versus SMA200D: Price is now back below the 200-day average after Oct 29's brief attempt to reclaim it. This is a long-term warning.
- MACD: The MACD made higher lows (-4.17 to -1.15) while price made roughly equal lows (about $270 on Oct 19 and Nov 5). This is a mild bullish divergence, but it is being undone by the Nov 5 reversal.
- RSI: Lower highs since Oct 29 and no confirmation of strength. RSI failed at 58 versus the 50-60 zone that capped rallies earlier.
- DI lines: −DI is back above +DI after a brief +DI surge to 29.2 on Oct 29. ADX is declining, which suggests the trend is maturing and a range may form.
- Rallies: Both rallies (Oct 29 and Nov 4) were rejected near $284, the SMA50D and upper Bollinger Band area.
CHART PATTERNS
- Prevailing downtrend with lower highs: Since the mid-August peak (about $298), price has stepped down in a channel of lower highs and lower lows.
- Possible Bullish Double Bottom: The lows near $270 (Oct 19 and Nov 5) with a neckline around $284. It would confirm only on a close above $284, which is about +4% from here. The target would be about $298 (neckline plus the $14 pattern height), but the second bottom has not yet been tested by a rally. The volume-backed rejection on Nov 5 weakens this pattern.
- Bearish alternative (range breakdown, similar to a Bearish Double Top / Triple Top structure at $284): Highs near $284 (Oct 29, Nov 4) are capped, and a break below $269-270 would give a measured target of about $255-256 (range height of about $14 subtracted from $270).
- Net read: The bearish structure has more evidence, given heavy-volume rejection, distribution and −DI dominance.
POTENTIAL SCENARIOS
- Scenario 1: Bearish Breakdown of the $270 Support — Sellers continue after the heavy-volume Nov 5 rejection, price fails at the EMA21/SMA200D zone, and the SMA50D/SMA200D death cross adds pressure. Trigger: daily close below $269.00 (the lower Bollinger Band and prior lows) or rejection at $278. Target: $262 first, then $257-$258. Invalidation: daily close above $279 with an improving CMF. (50% probability)
- Scenario 2: Neutral Range Chop — ADX is fading, so price oscillates between the $269-$270 floor and the $278 resistance (EMA21/SMA200D). Trigger: holding the $269 lows with MACD flat near the signal line. Target: $270-$278. Invalidation: close outside $268-$280. (20% probability)
- Scenario 3: Bullish Double Bottom Reclaim — Buyers defend the $270 double bottom, MACD makes a bullish crossover, and price reclaims the EMA21 and SMA200D. Trigger: close above $279, then above $284 (the neckline). Target: $284-$286, extension to $290. Invalidation: close below $269. (30% probability)
PRICE TARGETS
- Target Price: $268.50 (20-day horizon)
- Expected Range: $257.00 to $283.50 (width $26.50 = about 9.7% of current price, consistent with the 14-21 day guidance)
- Key Levels: Support at $270.00 (with $269.01 lower Bollinger Band), Resistance at $278.02 (SMA200D, alongside the $278.22 EMA21)
OVERALL BIAS
OVERALL BIAS: BEARISH - Price sits below every major moving average and VWAP with −DI dominating +DI, CMF in distribution, and a heavy-volume reversal on Nov 5 that rejected the $284 area. The SMA50D/SMA200D death cross looms, though a double-bottom reclaim above $284 is the key risk to this view.
This is educational analysis and not financial advice.