KWEB 20-day bullish forecast — Nov 8, 2026
- Bias: Bullish
- Timeframe: 20 days (made Nov 8, 2026, target date Nov 27, 2026)
- Price at analysis: $24.88
- Price target: $25.50
- Expected range: $24.20 – $26.70
- Result: Pending — graded after the close on Nov 27, 2026
Get a free AI analysis of KWEB today
Analysis
TECHNICAL INDICATORS
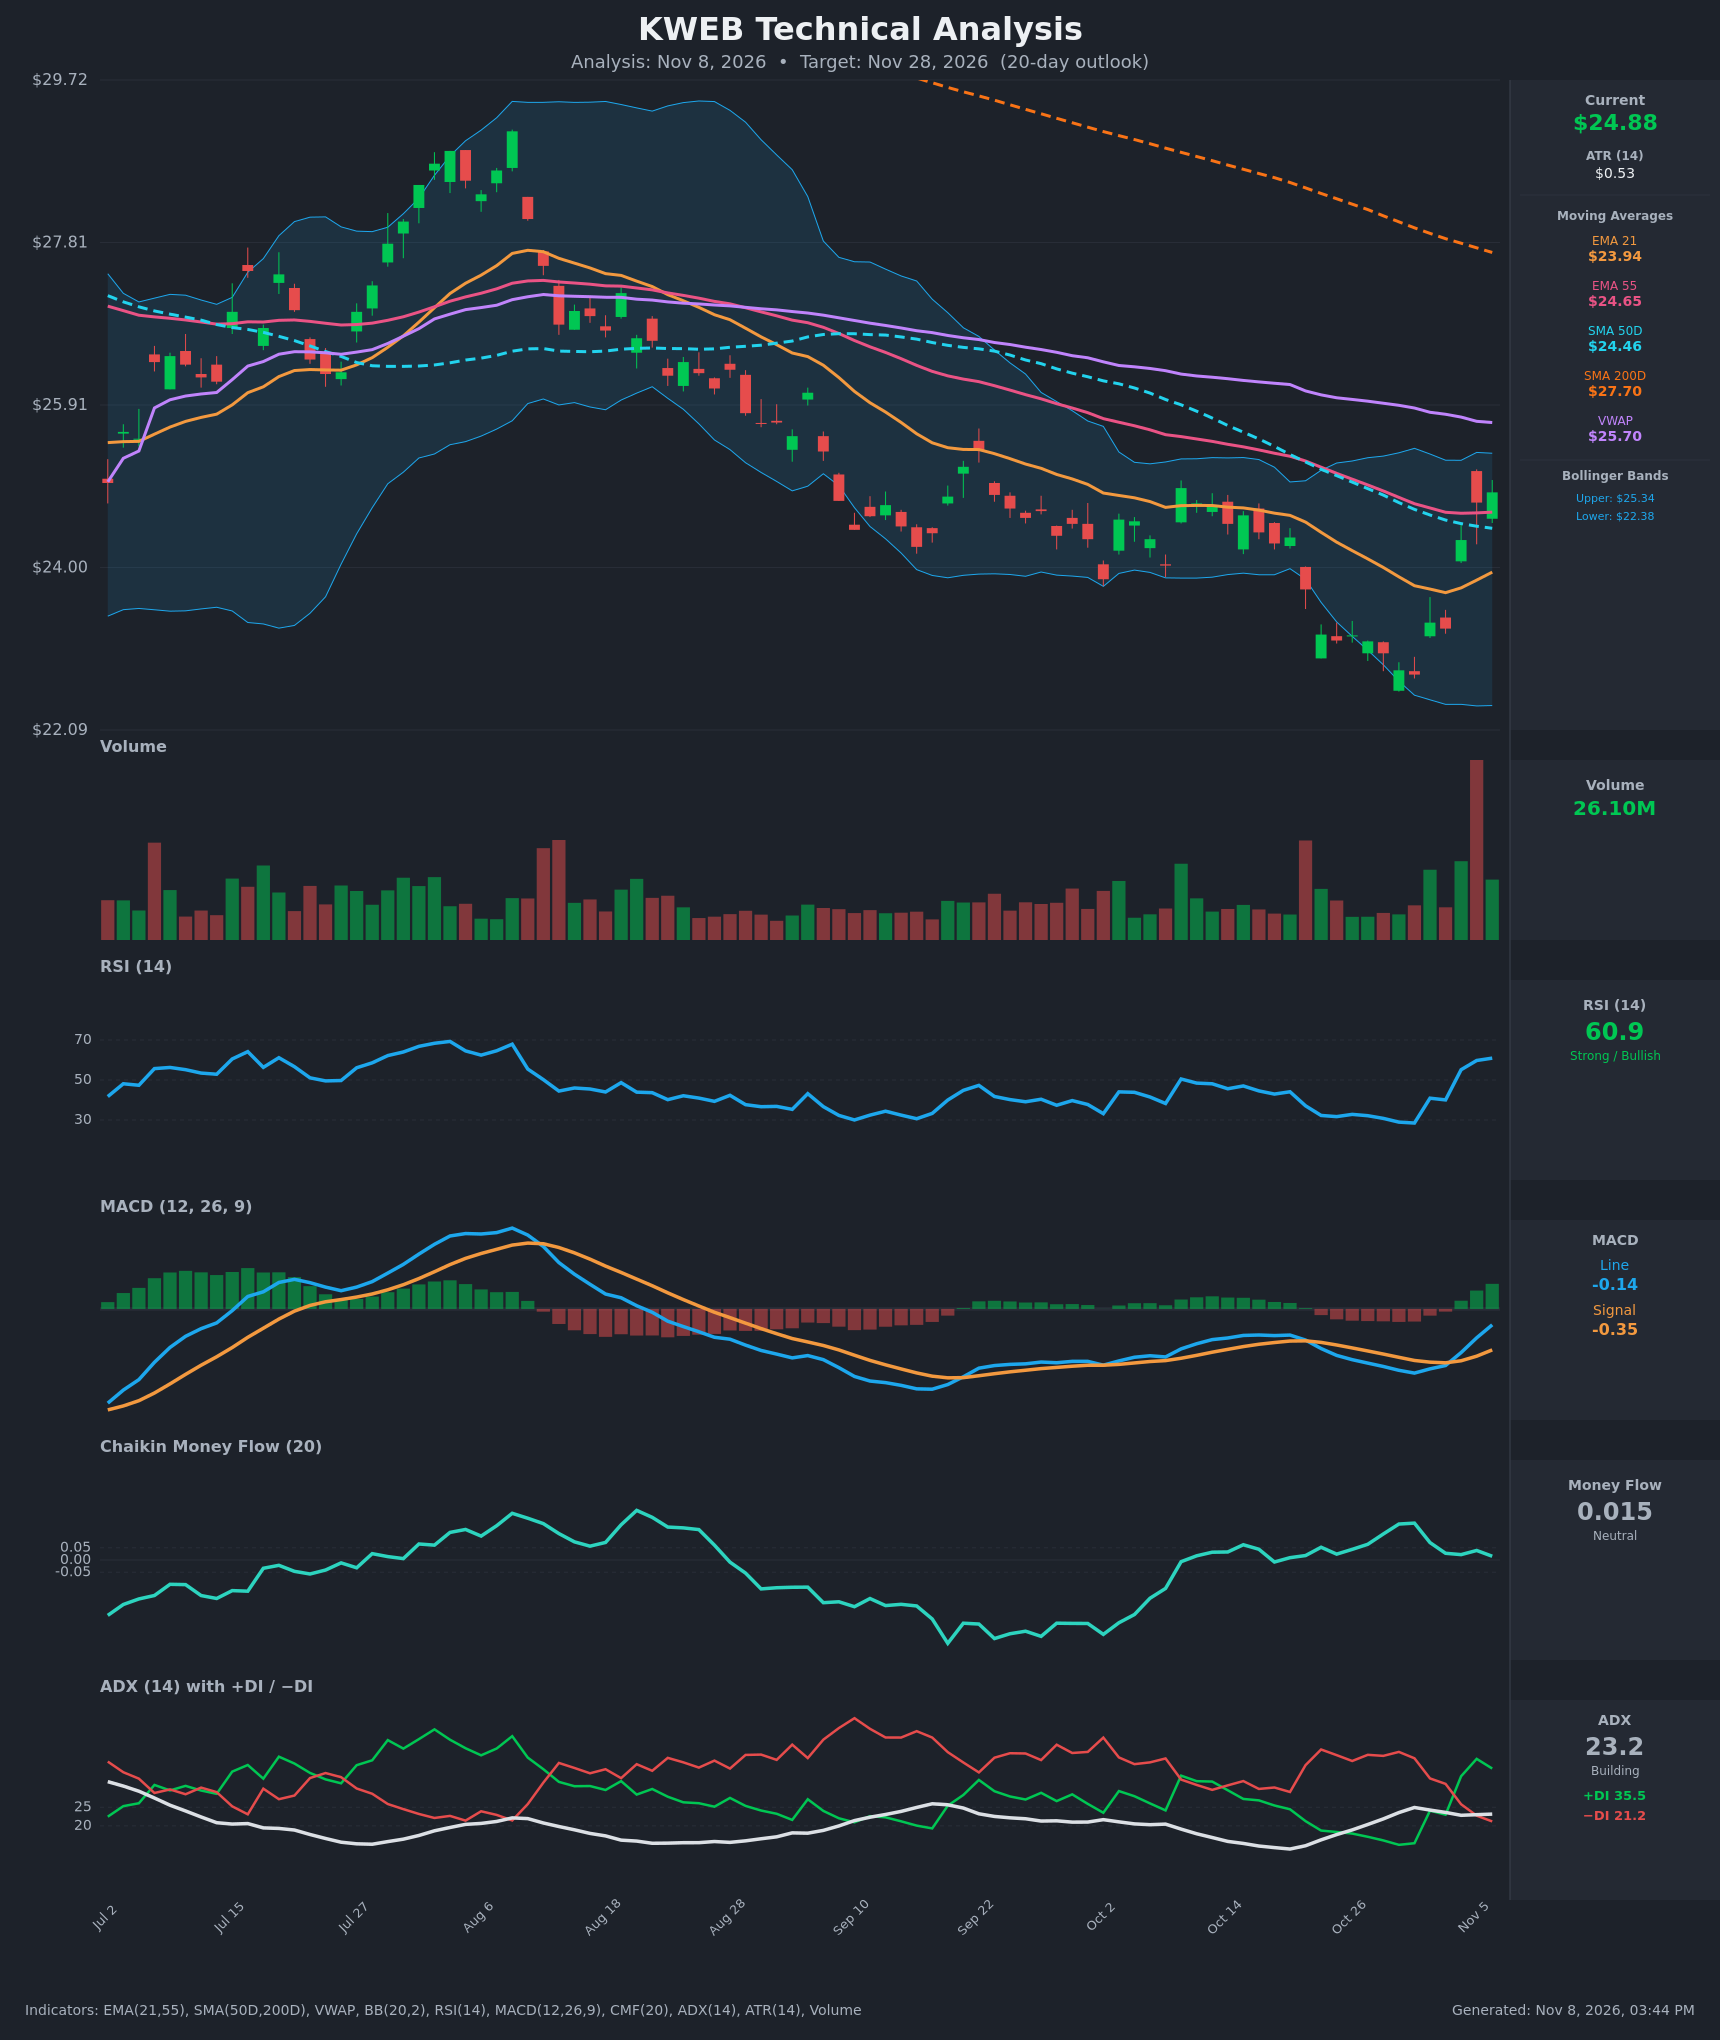
- RSI (14): 60.93, up sharply from 28.5 on Oct 30 and 40 on Nov 3. Momentum has swung from oversold to strong, and RSI is approaching but not yet at overbought (70). [Bullish]
- 20 EMA: The EMA 21 is $23.94 and price at $24.88 is about 3.9% above it. Price reclaimed the EMA 21 on Nov 4 and the EMA is now turning up, so it should act as support on pullbacks. Price is also above the EMA 55 ($24.65) and SMA50D ($24.46), both reclaimed within the last 2-3 sessions. The EMA 21 is still below the EMA 55, so no bullish EMA crossover yet. [Bullish]
- MACD: The line is -0.136 and the signal is -0.351. The line crossed above the signal on Nov 4, and the histogram has flipped positive and is expanding (about +0.21). Both lines are still below zero, so this is an early recovery rather than a confirmed trend change. [Bullish]
- Bollinger Bands (20): Upper band $25.34, lower band $22.38, and price is in the upper half of the range. The bands are wide, reflecting the recent selloff to the lower band and the snap-back. The upper band at $25.34 is about 1.8% away and is the first hurdle, though a break above it with momentum could lead to a band walk. [Neutral]
- CMF (20): 0.015, between ±0.05. It has been positive since Oct 21 but is fading from 0.15 on Oct 30, so the bounce lacks strong accumulation. [Neutral]
- ADX (14): 23.2, below 25 but rising in the last few sessions. +DI (35.5) is above −DI (21.2) after a bullish DI crossover on Nov 4. Bulls are in control, but trend strength is still developing. [Weak/Developing Trend, Bullish direction]
- Volume: 26.10M, the largest bar on the chart, accompanying the rebound through the EMA 55 and SMA50D. A high-volume thrust off the lows suggests capitulation followed by real buying interest. It needs follow-through to confirm. [Bullish]
DIVERGENCES & TRENDS
- RSI/Price: Price made a new low at $22.74 on Oct 30 with RSI at 28.5, so there was no classic bullish divergence. The bounce was a momentum reset, with RSI rising quickly from oversold.
- MACD: The bullish crossover on Nov 4 came below the zero line, which is a lower-conviction signal than one above zero. The histogram is expanding, which is constructive.
- DI crossover: +DI crossed above −DI on Nov 4, and −DI has fallen from about 40 to 21. Selling pressure has faded materially.
- Moving averages: SMA50D ($24.46) is well below SMA200D ($27.70), a death-cross structure and long-term downtrend. Price is far below SMA200D, so the larger trend is still bearish.
- VWAP: Price is below VWAP ($25.70), which is a lid for the bounce. VWAP has been declining and is the key overhead test.
- Breaks: Price broke back above the SMA50D, EMA 55 and the descending dashed trendline from the September highs.
- CMF: It remains positive but has flattened, so volume flow is not confirming the strength of the price move.
CHART PATTERNS
- Bullish Falling Wedge (reversal): From the September highs to the Oct 30 low, price made lower highs and lower lows inside a narrowing, declining channel. The recent surge broke above the upper trendline, which is a textbook breakout. The measured target is a retrace toward the top of the wedge, roughly $25.70-$26.50 (VWAP area and the late-September swing region).
- Potential Double Bottom / V-reversal: Lows around $22.74-$23.14 held, with a sharp bounce above the neckline-type resistance near $24.3-$24.8. A follow-through above $25.34 would strengthen this.
- Caution: The SMA200D at $27.70 is a long way overhead and still declining. Any rally inside a long-term downtrend can fade into the $25.34-$25.70 resistance cluster, which would make this a bear-market rally.
POTENTIAL SCENARIOS
- Scenario 1: Bullish Wedge Breakout Follow-Through — Price holds above the EMA 55/SMA50D zone, pushes through the upper Bollinger Band, and retests VWAP and the late-September highs as the MACD and DI trends continue. Trigger: a daily close above $25.34 with volume above average. Target: $25.70 first (VWAP), then $26.40. Invalidation: a daily close below $24.00 (below the EMA 21 and SMA50D). (52% probability)
- Scenario 2: Bearish Rejection at VWAP / Lower-High — The bounce stalls at the upper band and VWAP, CMF slips negative, and price rolls back under the EMA 55 and SMA50D. This would be consistent with a bear-market rally inside the SMA200D downtrend. Trigger: a rejection candle near $25.30-$25.70 and a close back below $24.46. Target: $23.90, then $23.00-$22.74. Invalidation: a daily close above $25.75. (30% probability)
- Scenario 3: Neutral Consolidation — Price digests the sharp rally between the EMA 21 and the upper Bollinger Band as ADX stays near 23. Trigger: failure to break either $25.34 or $24.00. Target: $24.20-$25.30 range. Invalidation: a break outside $23.90-$25.75. (18% probability)
PRICE TARGETS
- Target Price: $25.50 (20-day horizon, about +2.5% from $24.88)
- Expected Range: $24.20 to $26.70. Width is $2.50, or about 10.0% of the current price, in line with the 14-21 day guidance. It is also about 1 ATR-based standard deviation over 20 days (0.53 × √20 ≈ $2.35).
- Key Levels: Support at $24.46 (SMA50D; the EMA 21 at $23.94 is the next floor), Resistance at $25.70 (VWAP, with the upper Bollinger Band at $25.34 just below).
OVERALL BIAS
OVERALL BIAS: BULLISH - A bullish MACD crossover, a +DI/−DI flip, and a reclaim of the EMA 21/EMA 55/SMA50D on heavy volume after a falling-wedge breakout favor further upside toward VWAP and the $25.50-$26.40 zone. The long-term downtrend (price far below the declining SMA200D) and only neutral CMF cap conviction, so gains are likely to be gradual and resistance near $25.34-$25.70 may cause pauses.
This is educational analysis and not financial advice.