QCOM 20-day bullish forecast — Nov 8, 2026
- Bias: Bullish
- Timeframe: 20 days (made Nov 8, 2026, target date Nov 27, 2026)
- Price at analysis: $165.41
- Price target: $169.00
- Expected range: $158.00 – $177.00
- Result: Pending — graded after the close on Nov 27, 2026
Get a free AI analysis of QCOM today
Analysis
TECHNICAL INDICATORS
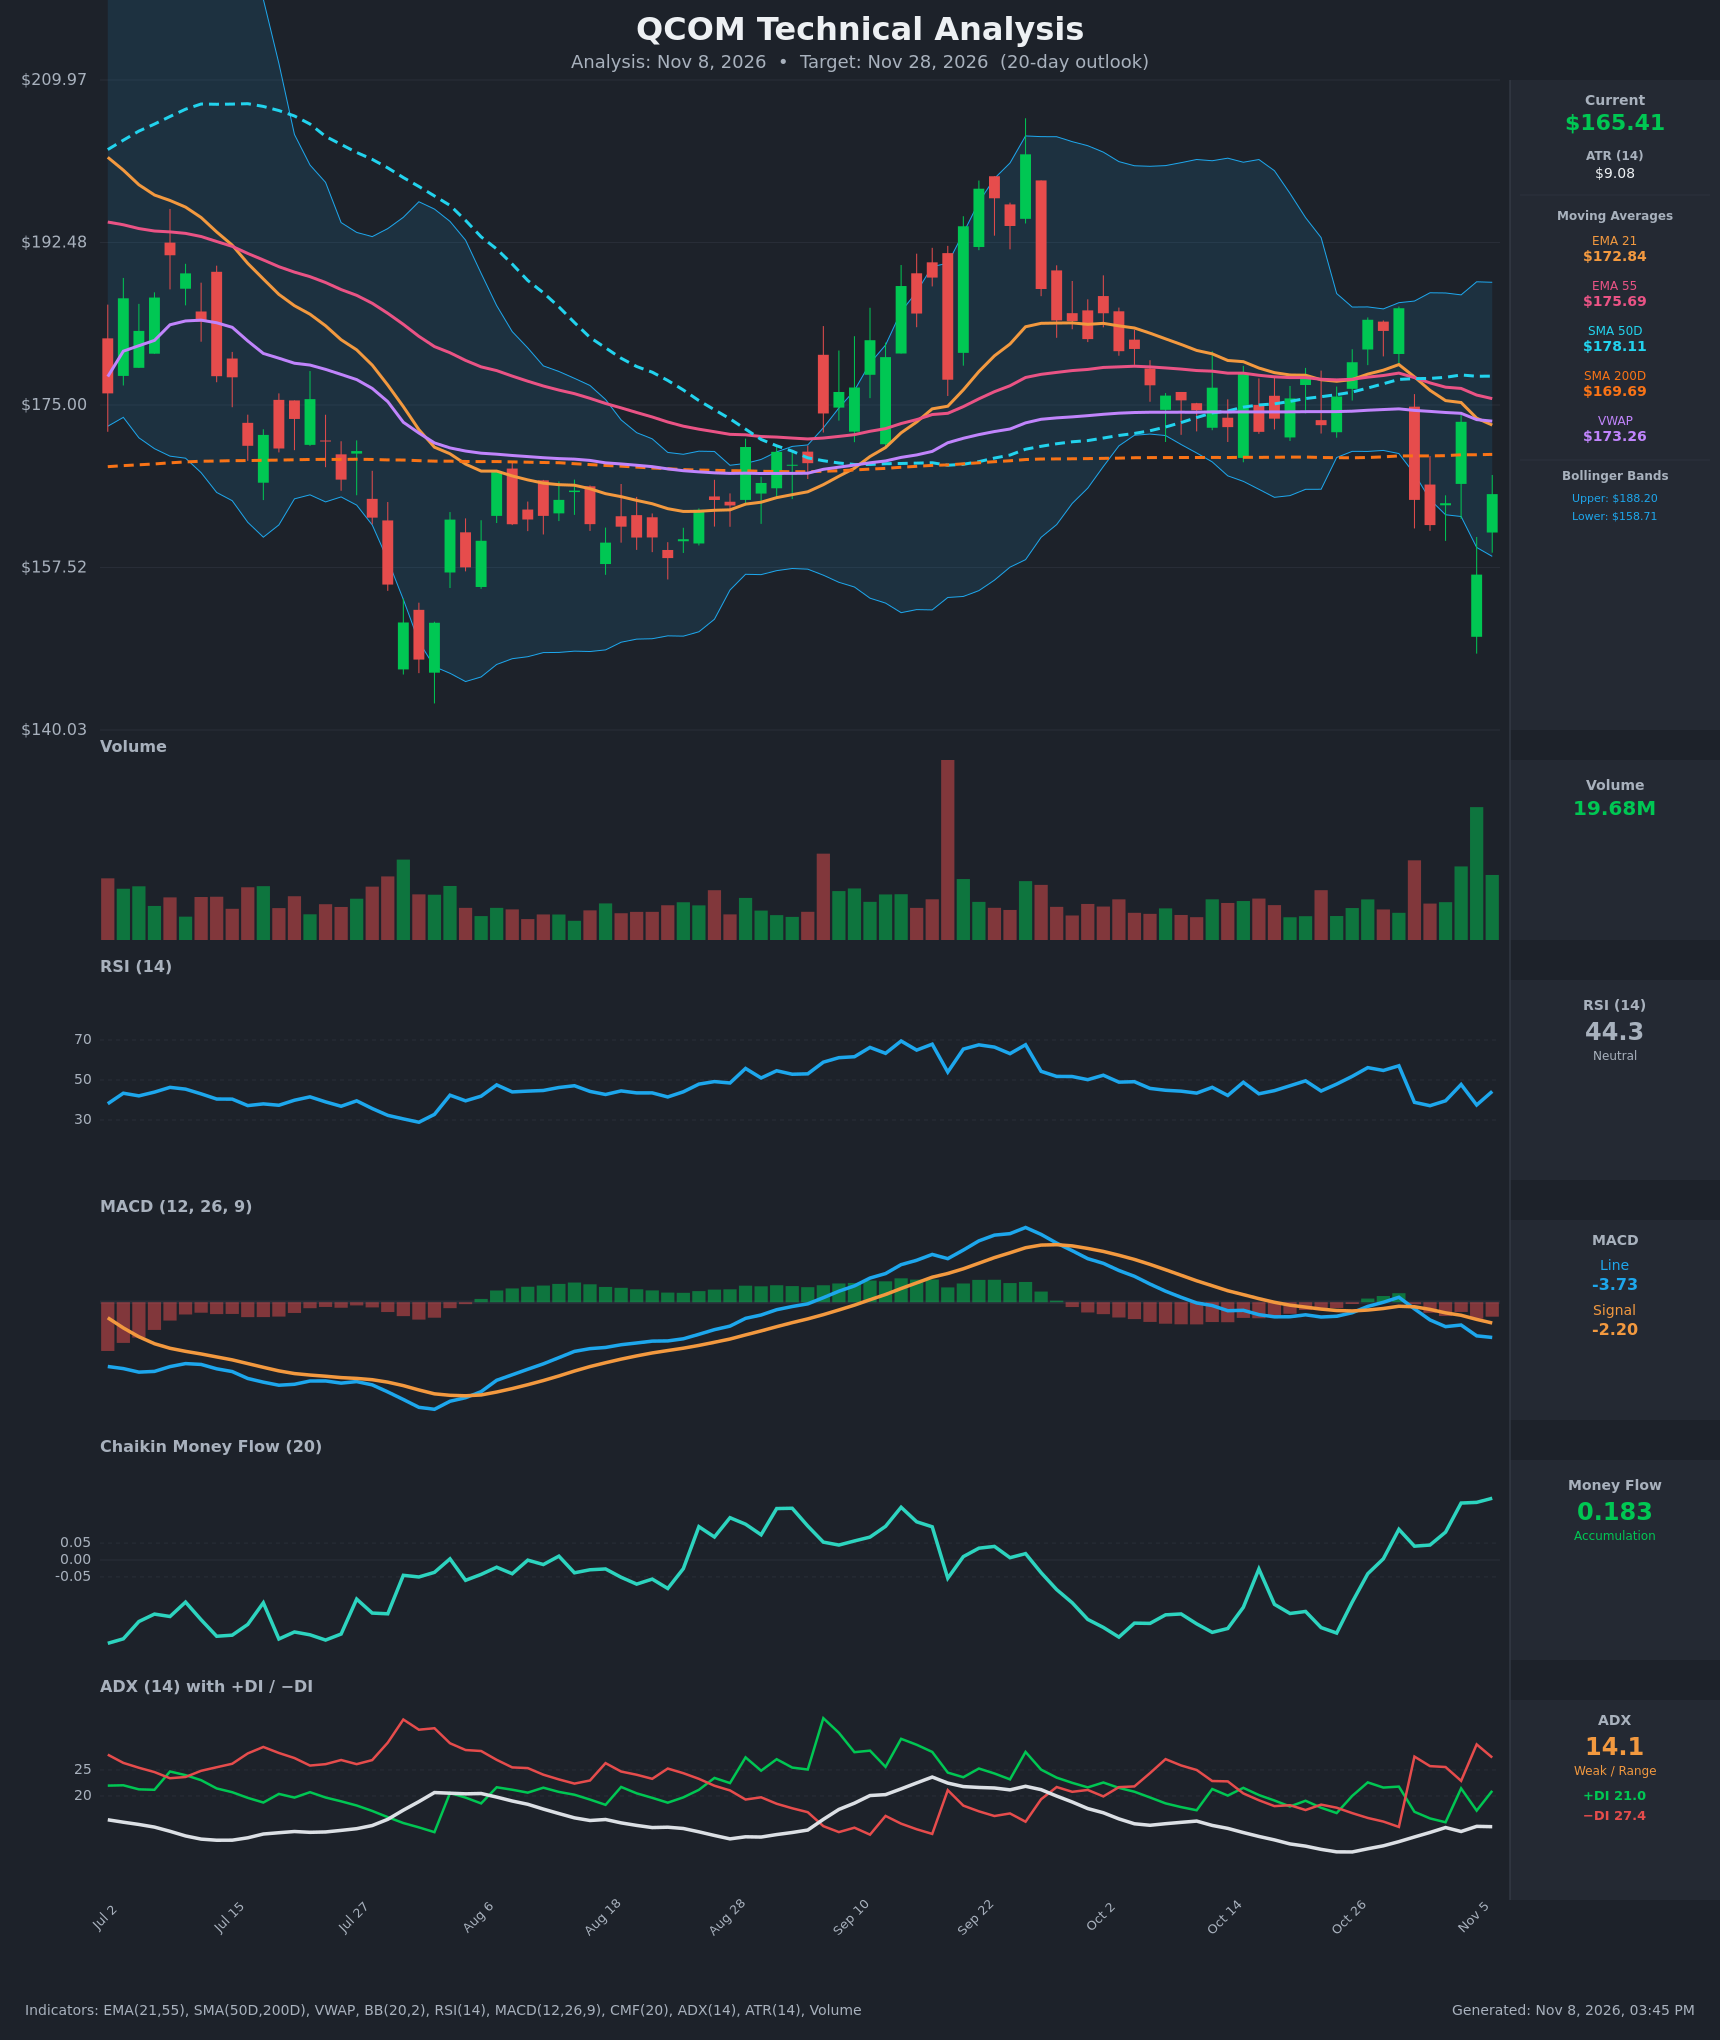
- RSI (14): 44.29, below the 50 midline but well off the 37.2–38.8 lows of Oct 30–Nov 5. It has bounced twice from the high-30s, so downside momentum is fading but not yet reversed. [Neutral]
- 20 EMA (EMA 21 = $172.84): Price at $165.41 is about 4.3% below the EMA 21, and below the EMA 55 ($175.69). The EMA 21 is sloping down and has crossed below the EMA 55 (Oct 30–Nov 2), a short-term bearish cross. Both averages now act as overhead resistance. [Bearish]
- MACD: Line -3.73 is below signal -2.20, and both are below zero. The bearish cross occurred on Oct 30 and the gap is widening, with a negative, expanding histogram. Momentum is clearly down, though the line is stretched from its recent range. [Bearish]
- Bollinger Bands (20): Upper $188.20, lower $158.71, midline about $173.5. Price is in the lower quarter of the band, after a Nov 5 close of $156.75 below the lower band and a snap back inside. Band width is wide because of the Oct 30 gap, so a mean-reversion bounce toward the midline is plausible. [Neutral]
- CMF (20): +0.183, well above the +0.05 threshold and rising since late October. Buying pressure is persisting despite the price drop, a constructive divergence. [Accumulation]
- ADX (14): 14.1 is weak and range-bound, though slightly rising. −DI (27.4) is above +DI (21.0), so sellers have the edge, but the move lacks trend strength. [Weak Trend, bearish lean]
- Volume: 19.68M on the latest green candle, among the highest in the visible window. Heavy volume on a bounce from the lows suggests dip buying or capitulation absorption. [Bullish interpretation]
Other moving averages: price is below SMA50D ($178.11) and VWAP ($173.26), and just below SMA200D ($169.69). SMA50D is still above SMA200D, so no death cross, but the gap is narrowing. Price has lost the long-term trend line, which is now resistance.
DIVERGENCES & TRENDS
- Bullish CMF divergence: price made a lower low and is below all key MAs, while CMF is at its highest level in the window (+0.183). Money flow is not confirming the price weakness.
- RSI: two higher-ish lows in the high-30s (38.8, 37.2, 37.5) on lower prices show momentum exhaustion. No confirmed divergence yet.
- MACD: trending down with a widening histogram, and no bullish divergence. This is the main bearish confirmation.
- Crossovers: the MACD bearish cross (Oct 30), the EMA 21 below EMA 55 cross, and the −DI/+DI bearish flip (Oct 30) all happened on the same gap-down day.
- Price action: the Oct 30 gap down from about $185 to $165 (-11%) was a sharp reversal off the top of the range. Price then recovered from $156.75 to $165.41 (+5.5%) on heavy volume. Volatility is elevated (ATR $9.08, about 5.5% of price).
CHART PATTERNS
- Bearish Double Top / Triple Top (range rejection): the highs near $184–185 (Oct 27–29) capped the rally, and the gap down confirmed the rejection from range resistance. The measured downside is already largely realized.
- Tentative Bullish Double Bottom: lows near $156–162 (Nov 2 and Nov 5) with a neckline around $173–175 (the Nov 4 high and the EMA 21 area). A close above the neckline would project to about $190, but this is unconfirmed and beyond a 20-day horizon.
- Gap: the unfilled gap between $165 and $185 acts as overhead supply. A partial fill toward $170–173 is the most likely retracement.
- Overall there is no clean classic pattern. The structure is a volatile range of about $157–$185 with price near the bottom, and ADX confirms there is no strong trend.
POTENTIAL SCENARIOS
- Scenario 1: Bullish Mean-Reversion Bounce — Accumulation (CMF +0.183), the heavy-volume bounce off the lower Bollinger Band, and weak ADX favor a retracement toward the declining moving averages and VWAP. Trigger: a daily close above SMA200D ($169.69) with RSI above 50. Target: $172.80–$173.30 (EMA 21/VWAP), with an extension to $177 (SMA50D area). Invalidation: a close below $158.70. (45% probability)
- Scenario 2: Bearish Continuation / Lower Low — Price stays below the bearish-stacked moving averages, MACD keeps falling, and −DI dominates. A rejection at $169.69–$172.84 leads to a retest of the lows. Trigger: a failed bounce at SMA200D/EMA 21 and a close below $158.70. Target: $150–$152 (about 1x ATR below the lows). Invalidation: a close above $173.30 (VWAP/EMA 21). (40% probability)
- Scenario 3: Neutral Chop — Price oscillates between $158 and $170 as the gap digests. Trigger: failure to close decisively beyond either boundary. Target: $162–$168. Invalidation: a close outside $157–$173. (15% probability)
PRICE TARGETS
- Target Price: $169.00 (20-day target, roughly +2.2%, a partial retracement toward SMA200D and the EMA 21)
- Expected Range: $158.00 to $177.00 (width $19.00, about 11.5% of the current price, in line with the 14–21 day guidance)
- Key Levels: Support at $158.71 (lower Bollinger Band; the Nov 5 low is at $156.75), Resistance at $169.69 (SMA200D), with further resistance at $172.84 (EMA 21)
OVERALL BIAS
OVERALL BIAS: BULLISH - Strong accumulation (CMF +0.183), a heavy-volume bounce from the lower Bollinger Band, and a weak-trend ADX favor a retracement toward $169–$173. Bearish MACD, the MA stack, and −DI dominance keep conviction modest, and a close below $158.70 would invalidate the call.
This is educational analysis and not financial advice.