SMCI 20-day bearish forecast — Nov 8, 2026
- Bias: Bearish
- Timeframe: 20 days (made Nov 8, 2026, target date Nov 27, 2026)
- Price at analysis: $28.76
- Price target: $26.50
- Expected range: $23.50 – $31.00
- Result: Pending — graded after the close on Nov 27, 2026
Get a free AI analysis of SMCI today
Analysis
TECHNICAL INDICATORS
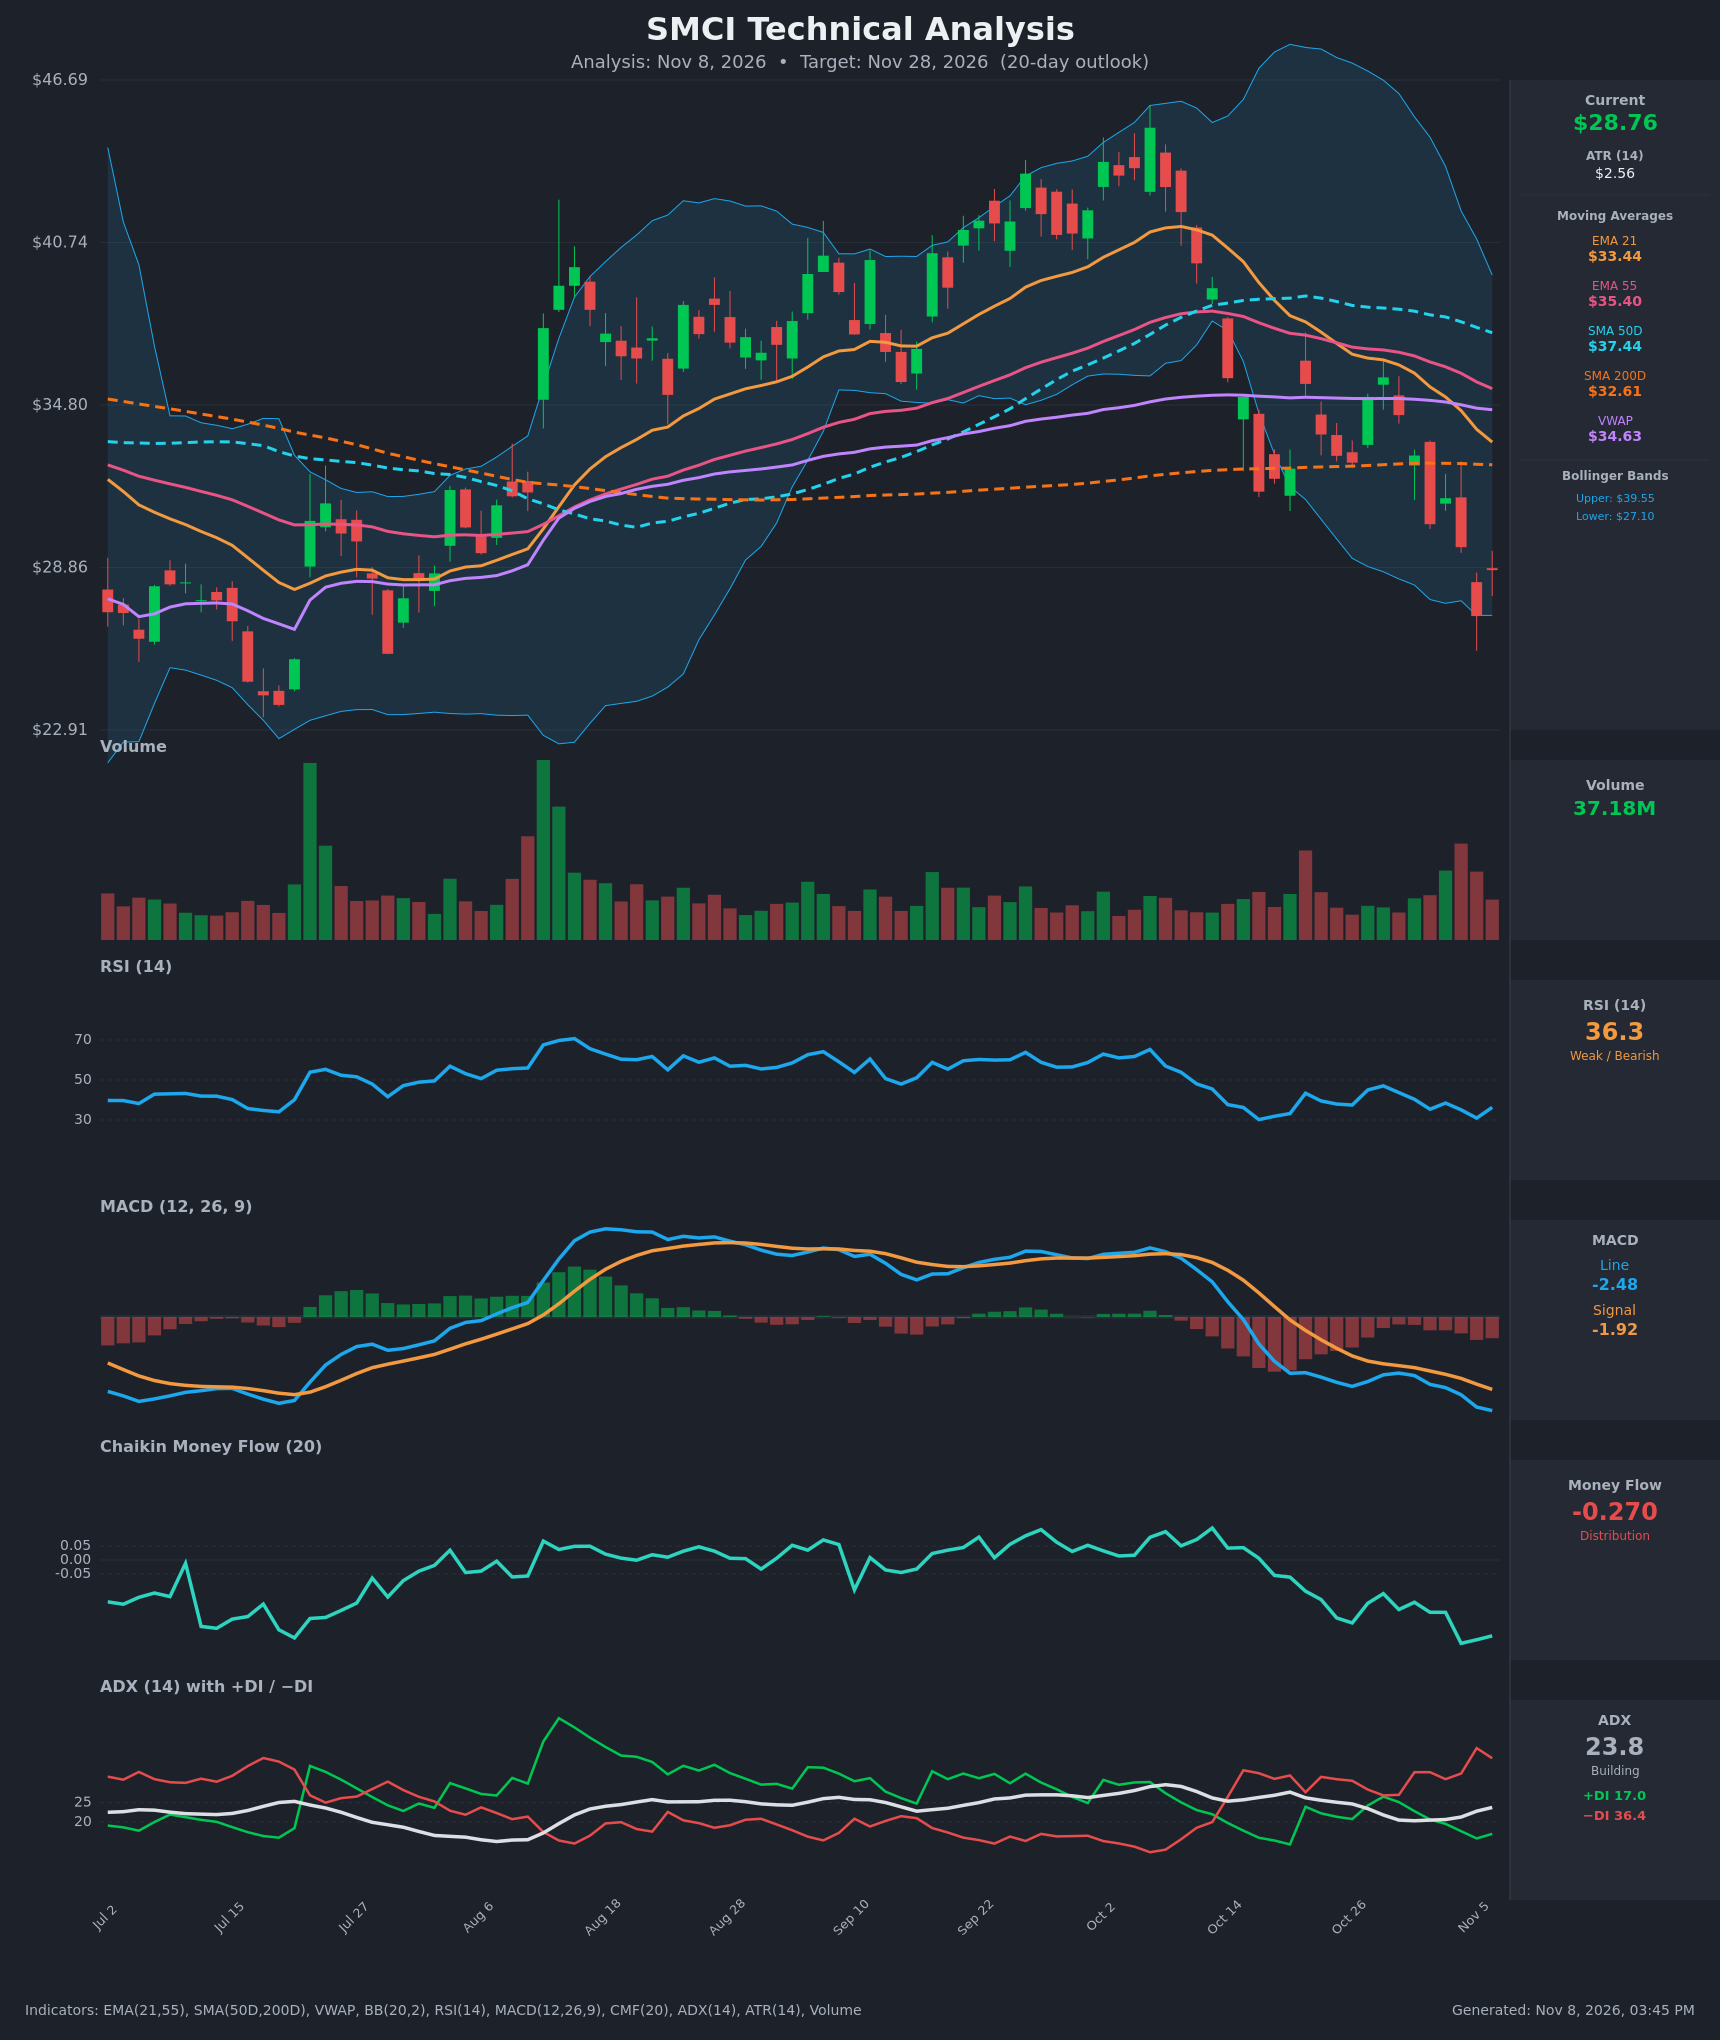
- RSI (14): 36.34, near the oversold line but not yet below 30. It bounced from 31.0 on Nov 5 and has made lower highs since the 65 peak in early October. Momentum is weak with no bullish divergence yet. [Bearish]
- 20 EMA: The chart shows the EMA 21 at $33.44, about 16% above price at $28.76. It is falling steeply and has crossed below the EMA 55 ($35.40). It acts as overhead resistance. [Bearish]
- MACD: Line at -2.48 is below signal at -1.92, and the gap is widening. The histogram is negative and expanding. Both lines are below zero, so there is no sign of a turn. [Bearish]
- Bollinger Bands (20): Upper $39.55, lower $27.10. Price is in the lower band area, about 13% of the band width above the lower band, after touching the band at $27.08 on Nov 5. The bands are still wide but starting to contract. Price is walking the lower band. A close back inside the bands could give a relief bounce, but this is not a reversal signal. [Bearish]
- CMF (20): -0.270, well below -0.05 and the weakest in the visible history. Heavy, sustained distribution. [Distribution]
- ADX (14): 23.8 and rising, close to the 25 threshold. −DI at 36.4 is far above +DI at 17.0, so the bears control the trend and it is strengthening. [Strong Trend - Bearish]
- Volume: 37.18M. Recent selling days (Nov 4-5) came on above-average, heavy volume, which confirms the breakdown. No capitulation spike or volume dry-up yet. [Bearish - selling pressure confirmed]
DIVERGENCES & TRENDS
- No bullish RSI or MACD divergence. Price made a new low at $27.08 and RSI (31.0) and MACD (-2.39 to -2.48) made new lows with it.
- Death cross: SMA50D ($37.44) is well above SMA200D ($32.61), so no death cross has occurred, but the SMA50D is rolling over.
- EMA21 has crossed below EMA55 (around Oct 23), a bearish crossover.
- MACD crossed below signal around Oct 19 and the gap keeps widening.
- Price is below every moving average (EMA21/55, SMA50, SMA200, and VWAP at $34.63). It broke below SMA200D ($32.61) in late October and that level is now resistance.
- DI crossover: −DI has been above +DI since Oct 30, and the gap is widening, with ADX turning up.
- CMF has trended down from positive in early October to -0.27, which confirms the distribution.
CHART PATTERNS
- Bearish Rising Wedge / Double Top (reversal): The September-October highs near $45 and the top at about $44 formed a lower-high topping structure. The October breakdown below the EMAs and the SMA200D completed the reversal.
- Price is now in a downtrend, making lower highs ($35.81 on Oct 28 and $31.39 on Nov 3) and lower lows ($27.08). That resembles a Bearish Flag/Pennant continuation after the sharp drop, but no clean flag has formed.
- The measured target from the topping structure points toward the prior base at $23-$25, the July-August low zone. That area is the next major support.
- Risk: price sits at the lower Bollinger Band and RSI is near 30, so a relief bounce toward $31-$33 (SMA200D/EMA21) is likely at some point.
POTENTIAL SCENARIOS
- Scenario 1: Bearish Downtrend Continuation — Sellers keep control with −DI dominant and CMF deeply negative. Price breaks below the $27.08 low and heads toward the $23-$25 July base. Trigger: close below $27.00 on volume. Target: $24.50-$25.50. Invalidation: close above $31.50. (50% probability)
- Scenario 2: Neutral/Bearish Relief Bounce Then Rollover — Oversold conditions produce a bounce toward the $31-$33 zone (SMA200D, EMA21, prior breakdown), which fails and rolls over. Trigger: RSI holds above 30 and price recovers $30. Target: $31.00-$32.50 then fade. Invalidation: close above $34.00. (30% probability)
- Scenario 3: Bullish Reversal — Capitulation low is in, with a volume spike and a bullish RSI divergence, and price reclaims the SMA200D. Trigger: close above $32.60 with CMF turning up. Target: $34.50-$35.50 (VWAP/EMA55). Invalidation: loss of $27.00. (20% probability)
PRICE TARGETS
For the 20-day timeframe (to Nov 28, 2026), the range width should be about 8-12% of price, or about $2.30-$3.45, but with ATR at $2.56 (about 9% of price) and the elevated volatility, I use a slightly wider range of about 20%, consistent with a high-volatility name.
- Target Price: $26.50
- Expected Range: $23.50 to $31.00 (width $7.50, about 26% of current price; wider than the 14-21 day guide because of ATR of about 9% and high realized volatility)
- Key Levels: Support at $27.08 (recent low and lower Bollinger Band), then $24.00; Resistance at $31.40 (the nearest meaningful level, prior bounce high and SMA200D zone at $32.61)
OVERALL BIAS
OVERALL BIAS: BEARISH - Price is below all key moving averages, MACD is expanding negative, CMF is at -0.27 (heavy distribution), and −DI (36.4) dominates +DI (17.0) with ADX rising. A relief bounce is possible given the oversold RSI, but the trend favors a move toward the $24-$27 area.
This is educational analysis and not financial advice.