QQQ 20-day bearish forecast — Nov 8, 2026
- Bias: Bearish
- Timeframe: 20 days (made Nov 8, 2026, target date Nov 27, 2026)
- Price at analysis: $656.10
- Price target: $642.00
- Expected range: $610.00 – $676.00
- Result: Pending — graded after the close on Nov 27, 2026
Get a free AI analysis of QQQ today
Analysis
TECHNICAL INDICATORS
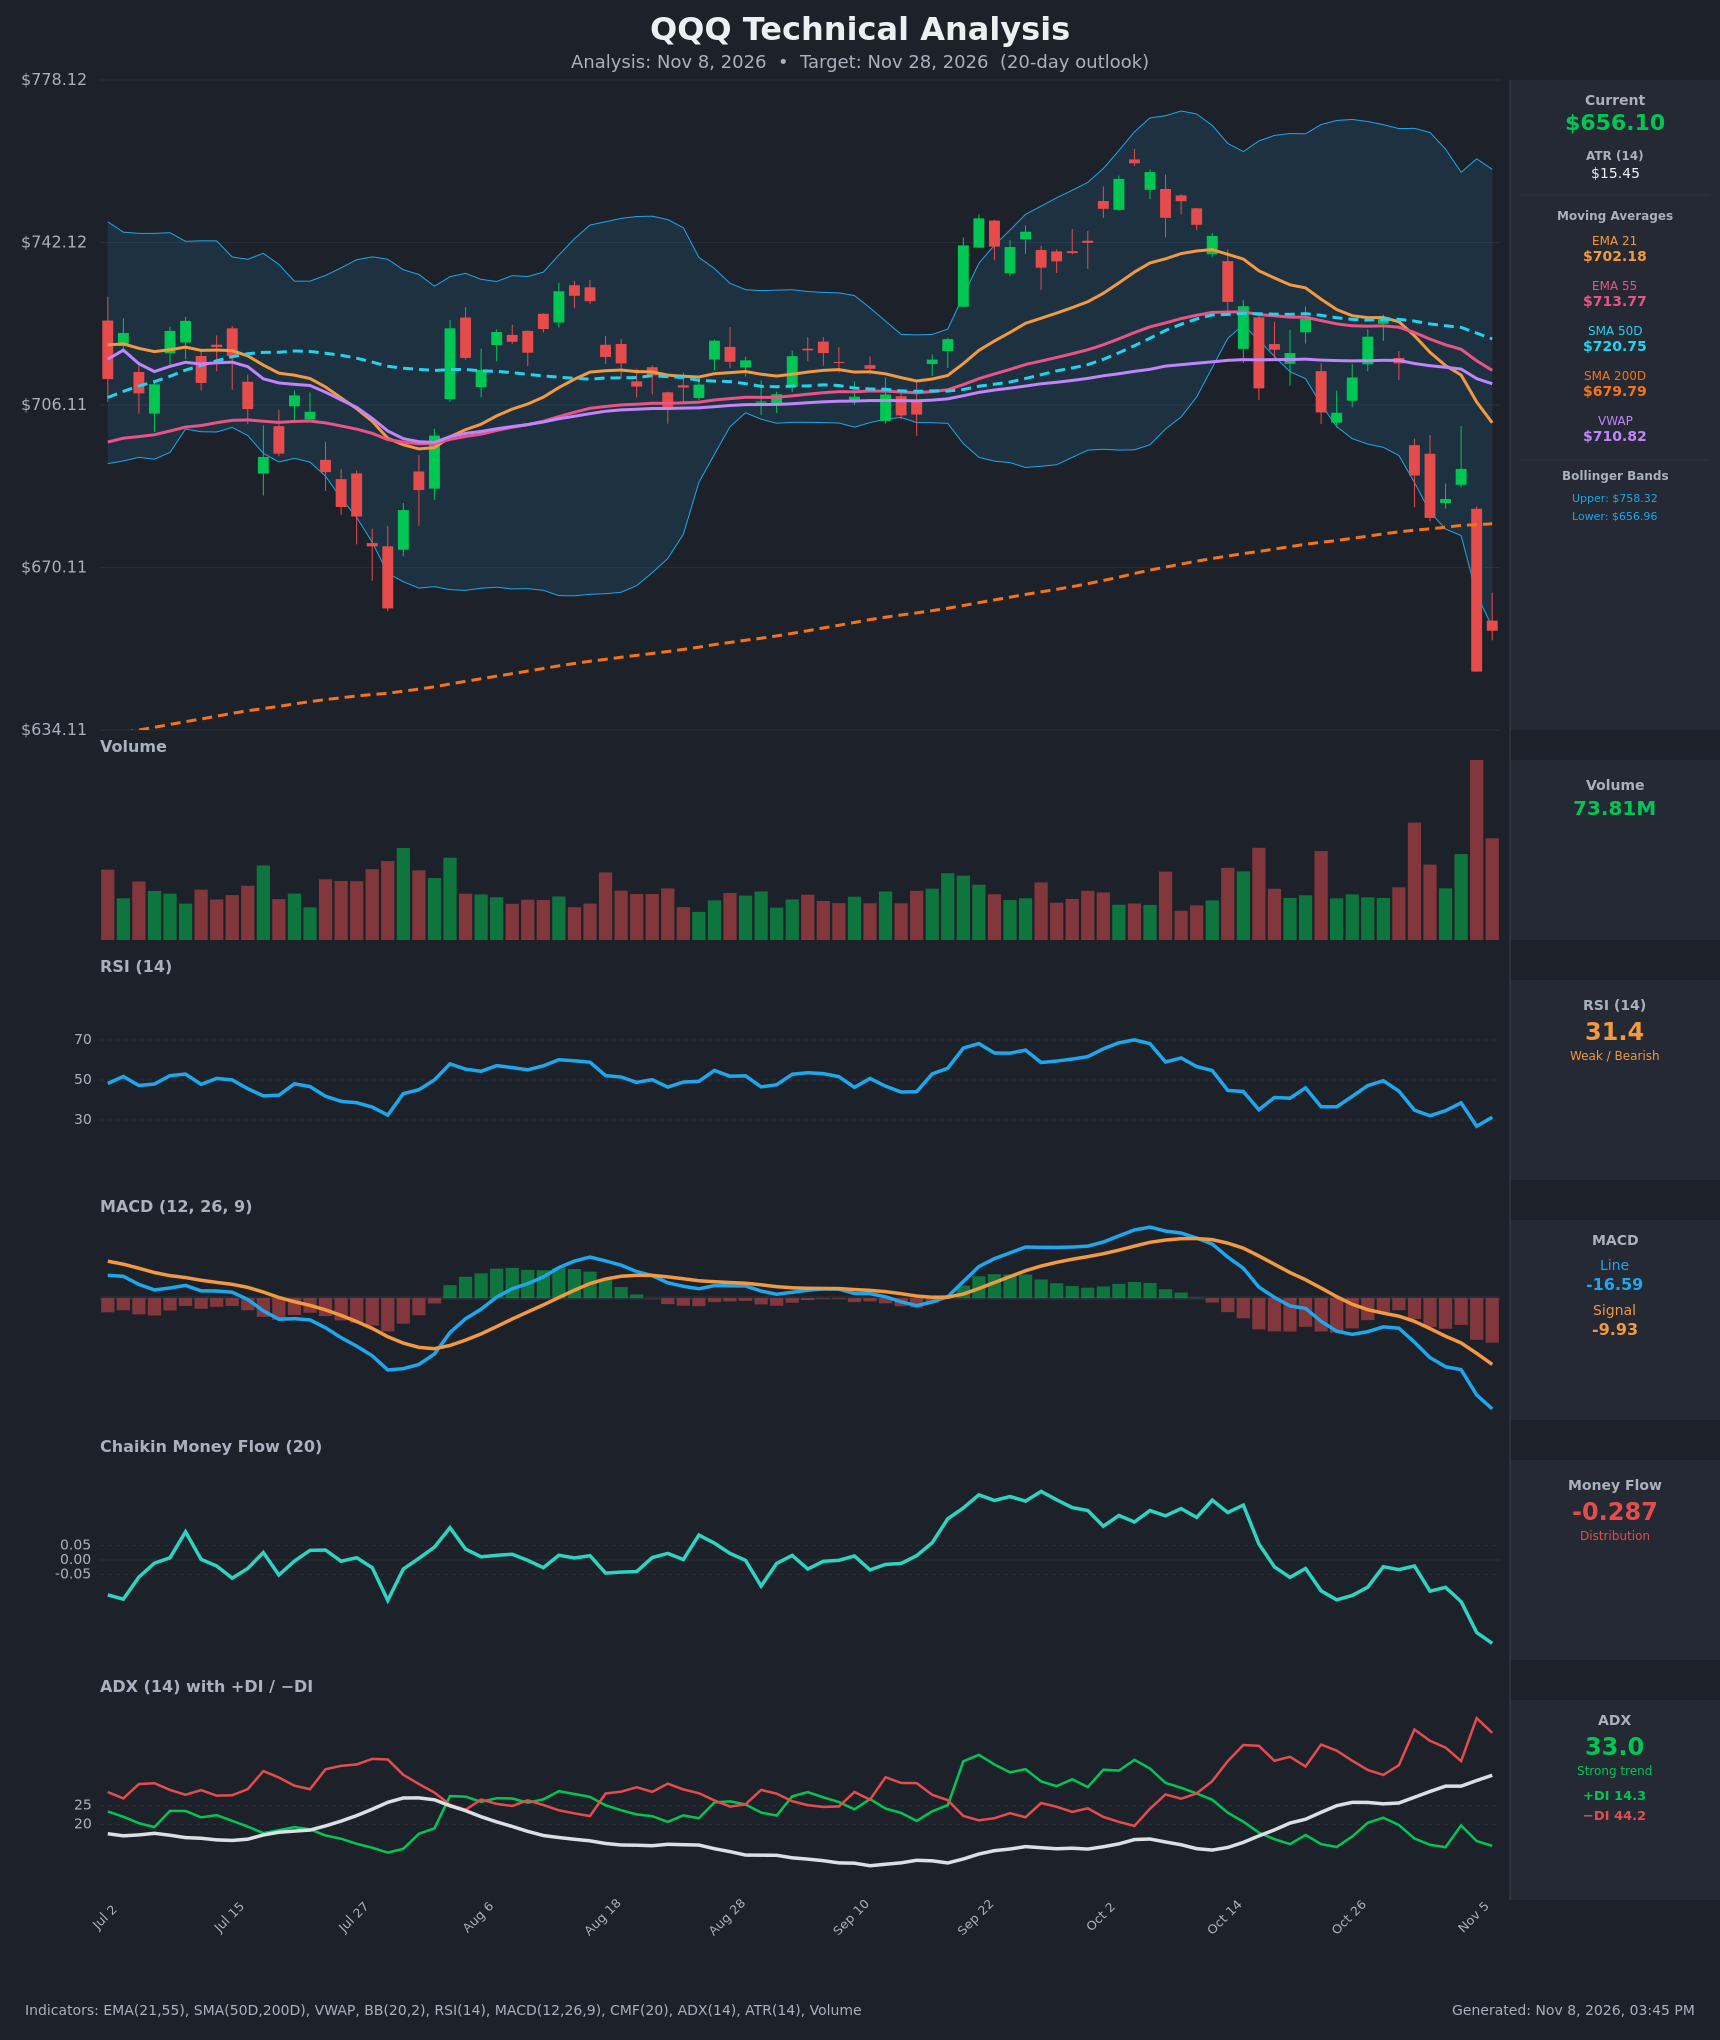
- RSI (14): 31.40, just above the oversold line. It bounced from 26.9 on Nov 5, but the trend since Oct 28 (49.6) has been lower, with lower highs on each bounce. Momentum is weak and near oversold, which raises the odds of a relief bounce but does not signal a reversal. [Bearish]
- 20 EMA (EMA 21): $702.18, with price about 6.6% below it. EMA21 crossed below EMA55 ($713.77) around Oct 30 and is falling steeply. Price is below every moving average except none: EMA21, EMA55, SMA50D and VWAP are all overhead resistance. [Bearish]
- MACD: Line -16.59 is below Signal -9.93, with a negative histogram of about -6.7 that is widening. The bearish crossover came around Oct 26 and the gap has kept growing, so downside momentum is accelerating. [Bearish]
- Bollinger Bands (20): Price of $656.10 sits at or just under the lower band ($656.96). The bands are wide (upper $758.32), reflecting the volatility expansion. A close outside the lower band in a strong trend is usually a "band walk" that can continue. It is also stretched enough that a snap-back toward the mid-band is possible. [Bearish]
- CMF (20): -0.287, deeply negative and falling from near +0.1 in mid-Oct. This is heavy, sustained distribution and the weakest reading on the chart. [Distribution]
- ADX (14): 33.0 and rising, which marks a strong trend. -DI (44.2) is far above +DI (14.3), so bears are firmly in control. [Strong Trend – Bearish]
- Volume: 73.81M on the latest bar, after a huge-volume red candle on Nov 5 (the largest in the window, close $647.05) that broke below the 200D SMA intraday. Heavy volume on the breakdown confirms the selling. It may also hint at partial capitulation, but the follow-through bar was only a modest bounce. [Bearish – high-volume breakdown]
DIVERGENCES & TRENDS
- No bullish divergence yet. RSI made a lower low (26.9) alongside the lower price low, and MACD and CMF are making new lows with price.
- Price made a lower high at about $725 on Oct 27-28 versus the roughly $750 peak in early Oct, followed by a sharp lower low. That is a clear downtrend structure.
- Crossovers so far:
- EMA21 crossed below EMA55 (bearish).
- MACD crossed below its signal line (bearish).
- -DI crossed above +DI (bearish).
- A death cross has not happened yet: SMA50D ($720.75) is still above SMA200D ($679.79), but SMA50D is rolling over. The gap has narrowed from about $52 to $41.
- Price has closed below SMA200D ($679.79) for the first time in this window, after trading above it all year. This is a major long-term trend warning.
- CMF and ADX are trending hard in the bearish direction. RSI near 30 is the only mild offset.
CHART PATTERNS
- Bearish Head and Shoulders / Double Top (loose): The Sep-Oct highs near $745-750, followed by a lower high near $725, and a break through the roughly $690 support zone resemble a top formation. The measured move from a ~$750 top to ~$690 neckline is about $60, which projects to about $630.
- Reversal context: The break below SMA200D and the fall out of the Oct consolidation (about $705-$725) are consistent with a bearish continuation or breakdown after the failed rally.
- Bullish counterpoint: A sharp volume-spike flush into the lower band and the 200D area can mark a short-term exhaustion low, which allows a bounce toward $680-$702. A rebound would most likely fail at overhead resistance.
POTENTIAL SCENARIOS
- Scenario 1: Bearish Trend Continuation — The strong downtrend (ADX 33, -DI dominant, CMF -0.29) continues after a brief pause, and the 200D SMA turns into resistance. Trigger: failure to reclaim $680 and a close below $638-$647 (the Nov 5 low zone). Target: $620-$640, with an extension to about $610. Invalidation: daily close above $702 (EMA21) with CMF turning positive. (50% probability)
- Scenario 2: Bullish Oversold Relief Rally — RSI near 30, the lower Bollinger Band and the volume flush trigger a mean-reversion bounce toward the moving averages. Trigger: reclaim of SMA200D at $679.79 on rising volume. Target: $690-$702 (EMA21 and the gap fill). Invalidation: rejection at $680-$690 and a new low below $638. (38% probability)
- Scenario 3: Neutral Choppy Basing — Price consolidates in a $640-$680 range as selling fades. Trigger: low-volume sideways closes holding the Nov 5 low. Target: about $655-$665. Invalidation: close outside $638-$682. (12% probability)
PRICE TARGETS
- Target Price: $642.00 (20-day horizon, Nov 28)
- Expected Range: $610.00 to $676.00 (width $66, about 10.1% of current price, in line with the 14-21 day guidance)
- Key Levels: Support at $638.00 (Nov 5 intraday low zone), Resistance at $679.79 (SMA200D, with $702.18 EMA21 behind it)
OVERALL BIAS
OVERALL BIAS: BEARISH - A strong, rising-ADX downtrend with -DI dominance, a bearish MACD and EMA crossover, deeply negative CMF (-0.29), and a high-volume breakdown below the 200D SMA all favor further downside. Oversold RSI and the lower-band touch make a relief bounce a real risk, but rallies should meet heavy resistance at $680-$702.
This is educational analysis and not financial advice.