SPCX 20-day bearish forecast — Nov 8, 2026
- Bias: Bearish
- Timeframe: 20 days (made Nov 8, 2026, target date Nov 27, 2026)
- Price at analysis: $134.27
- Price target: $128.50
- Expected range: $122.00 – $142.00
- Result: Pending — graded after the close on Nov 27, 2026
Get a free AI analysis of SPCX today
Analysis
TECHNICAL INDICATORS
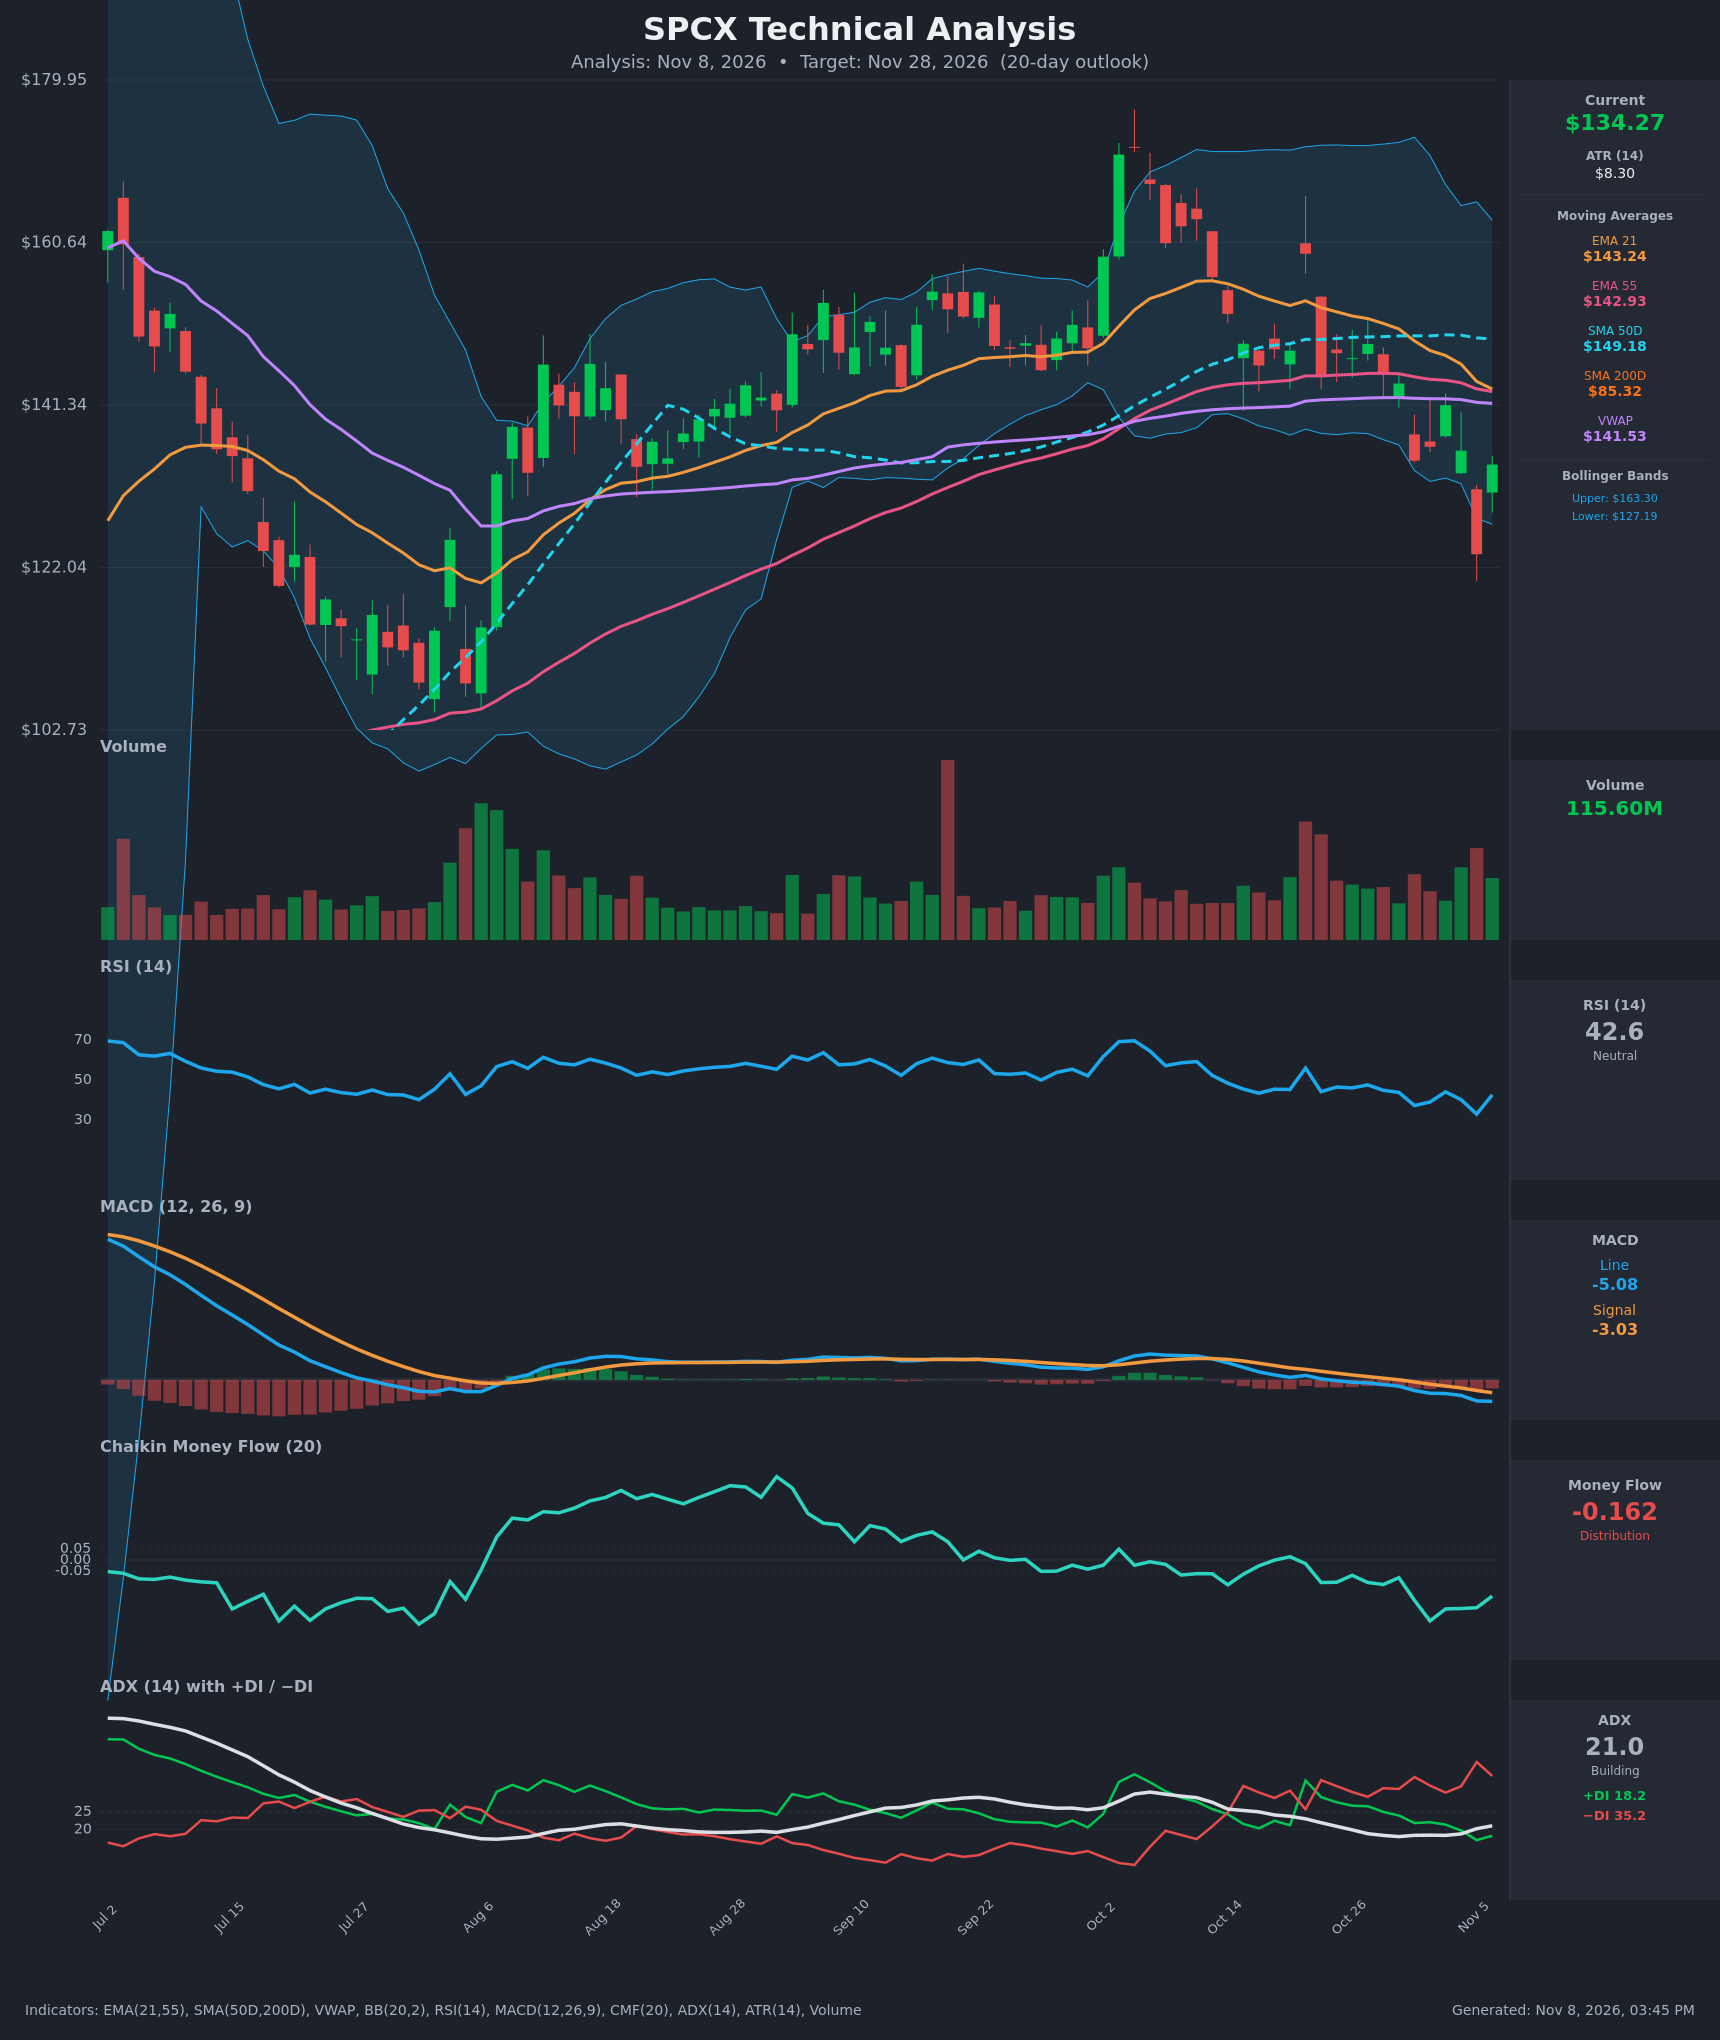
- RSI (14): 42.56, rebounding from 32.9 (near oversold) on Nov 5. It remains below 50, and the pattern of lower highs and lower lows since mid-October shows momentum still tilted down. The bounce is modest. [Bearish]
- 20 EMA (EMA 21): $143.24, with price at $134.27, about 6% below it. The EMA 21 is falling steeply (from $153.69 on Oct 19) and has nearly converged with the EMA 55 at $142.93. Price is below both, so the cluster at roughly $143 acts as overhead resistance. [Bearish]
- MACD: Line -5.08 is below Signal -3.03. The bearish crossover happened around Oct 29–30 and the gap is widening, with a negative and expanding histogram. Momentum is still deteriorating. [Bearish]
- Bollinger Bands (20): Upper $163.30, lower $127.19, middle about $145. Price at $134.27 sits in the lower third, after a Nov 5 close at $123.62 that pierced the lower band and then snapped back inside. Bands are wide (ATR about 6% of price), so volatility is high. A mean-reversion bounce is possible, but the trend is down. [Neutral]
- CMF (20): -0.162, well below -0.05 and in sustained negative territory since late October. Selling pressure dominates and there is no sign of accumulation. [Distribution]
- ADX (14): 21.0 and edging up from 18, with -DI 35.2 well above +DI 18.2. The trend is not yet strong (<25), but the directional bias is clearly bearish and ADX is starting to rise. [Weak but Building Trend – Bearish]
- Volume: 115.6M, elevated against the recent average. The Nov 5 flush ($123.62) and the Nov 6 bounce both came on heavy volume. That suggests capitulation-style activity, though the bounce has not yet shown a decisive follow-through. [Mixed – selling climax with attempted rebound]
DIVERGENCES & TRENDS
- No clean divergence. RSI made a higher low on Nov 6 against Nov 5's low, but price has also bounced, so this is a rebound rather than a divergence. RSI's Oct 30 low of 37.2 was undercut by the 32.9 low, so it confirms the price lows.
- Moving averages: EMA 21 crossed below EMA 55 (≈ Nov 6, with EMA 21 $143.24 vs EMA 55 $142.93). This is a fresh bearish cross. SMA50D ($149.18) is rolling over slightly. SMA200D ($85.32) is far below and still rising, so the long-term trend remains up but price is in a corrective phase.
- VWAP: Price is below VWAP ($141.53), which is a selling-pressure signal.
- MACD: Bearish crossover with the histogram expanding to the downside; both lines have fallen below zero.
- DI: -DI has dominated +DI since Oct 22, and the gap has widened. A DI crossover back to the bulls is not close.
- CMF: Its slide from the highs near +0.2 in September to -0.16 shows a distribution trend over several weeks.
- Price structure: Lower highs since the Oct 2 peak (~$172), and the $123–$127 area has just been tested.
CHART PATTERNS
- Bearish Rising Wedge / Head-and-Shoulders-like top (loosely): The decline from the $172 spike peak (Oct 2) through lower highs ($159, $155, $147) resembles a distribution top. The failed attempts at $147–$149 (SMA50D) form a resistance zone.
- Possible Bearish Flag/Pennant area: Consolidation of roughly $143–$149 in late October, followed by a breakdown, is consistent with a bearish continuation. The measured move points to the $120s.
- Support to watch: The $123–$127 area (Nov 5 low plus the lower Bollinger Band) is the key floor. A decisive break would expose roughly $115 and then the $102–$110 base from July/August.
- Significance: The pattern favors bearish continuation, though the Nov 5 capitulation wick leaves room for a relief bounce to $140–$143.
POTENTIAL SCENARIOS
- Scenario 1: Bearish Continuation Lower — The bounce stalls beneath the $141–$143 resistance cluster (VWAP, EMA 21/55). Price rolls over and retests the $123 low, possibly breaking it. Trigger: rejection at $140–$143 or a close below $127. Target: $122–$125, with an extension to $115. Invalidation: daily close above $144 on rising volume. (50% probability)
- Scenario 2: Neutral Range-Bound Chop — After the capitulation low, price stays between $123 and $143 as volatility compresses. Trigger: holding above $127 while failing at $142. Target: $128–$140. Invalidation: close outside the $123–$143 range. (20% probability)
- Scenario 3: Bullish Relief Rally — The Nov 5 capitulation wick plus the oversold RSI bounce leads to a mean-reversion move up to the Bollinger midline. Trigger: close above $141.5 (VWAP) with volume. Target: $145–$149 (EMA cluster / SMA50D). Invalidation: close back below $127. (30% probability)
PRICE TARGETS
For a 20-day horizon, the range width should be about 8–12% of the current price, but ATR is about $8.30 (6.2%), so I am widening it toward the upper end because volatility is elevated. Range: $122.00 to $142.00 = $20.00, or 14.9% of $134.27. This is slightly above the guide but justified by the high-volatility regime.
- Target Price: $128.50 (a drift lower toward the lower Bollinger Band and the Nov 5 low zone)
- Expected Range: $122.00 to $142.00
- Key Levels: Support at $123.00, Resistance at $143.00
OVERALL BIAS
OVERALL BIAS: BEARISH - Price is below the EMA 21/55, VWAP and SMA50D. MACD has crossed bearishly, -DI dominates +DI (35 vs 18), and CMF is at -0.16, which shows persistent distribution. Resistance at $141–$143 is likely to cap relief bounces, which favors a retest of the $123–$127 support zone.
This is educational analysis and not financial advice.