TSLA 20-day bearish forecast — Nov 8, 2026
- Bias: Bearish
- Timeframe: 20 days (made Nov 8, 2026, target date Nov 27, 2026)
- Price at analysis: $358.22
- Price target: $349.00
- Expected range: $318.00 – $370.00
- Result: Pending — graded after the close on Nov 27, 2026
Get a free AI analysis of TSLA today
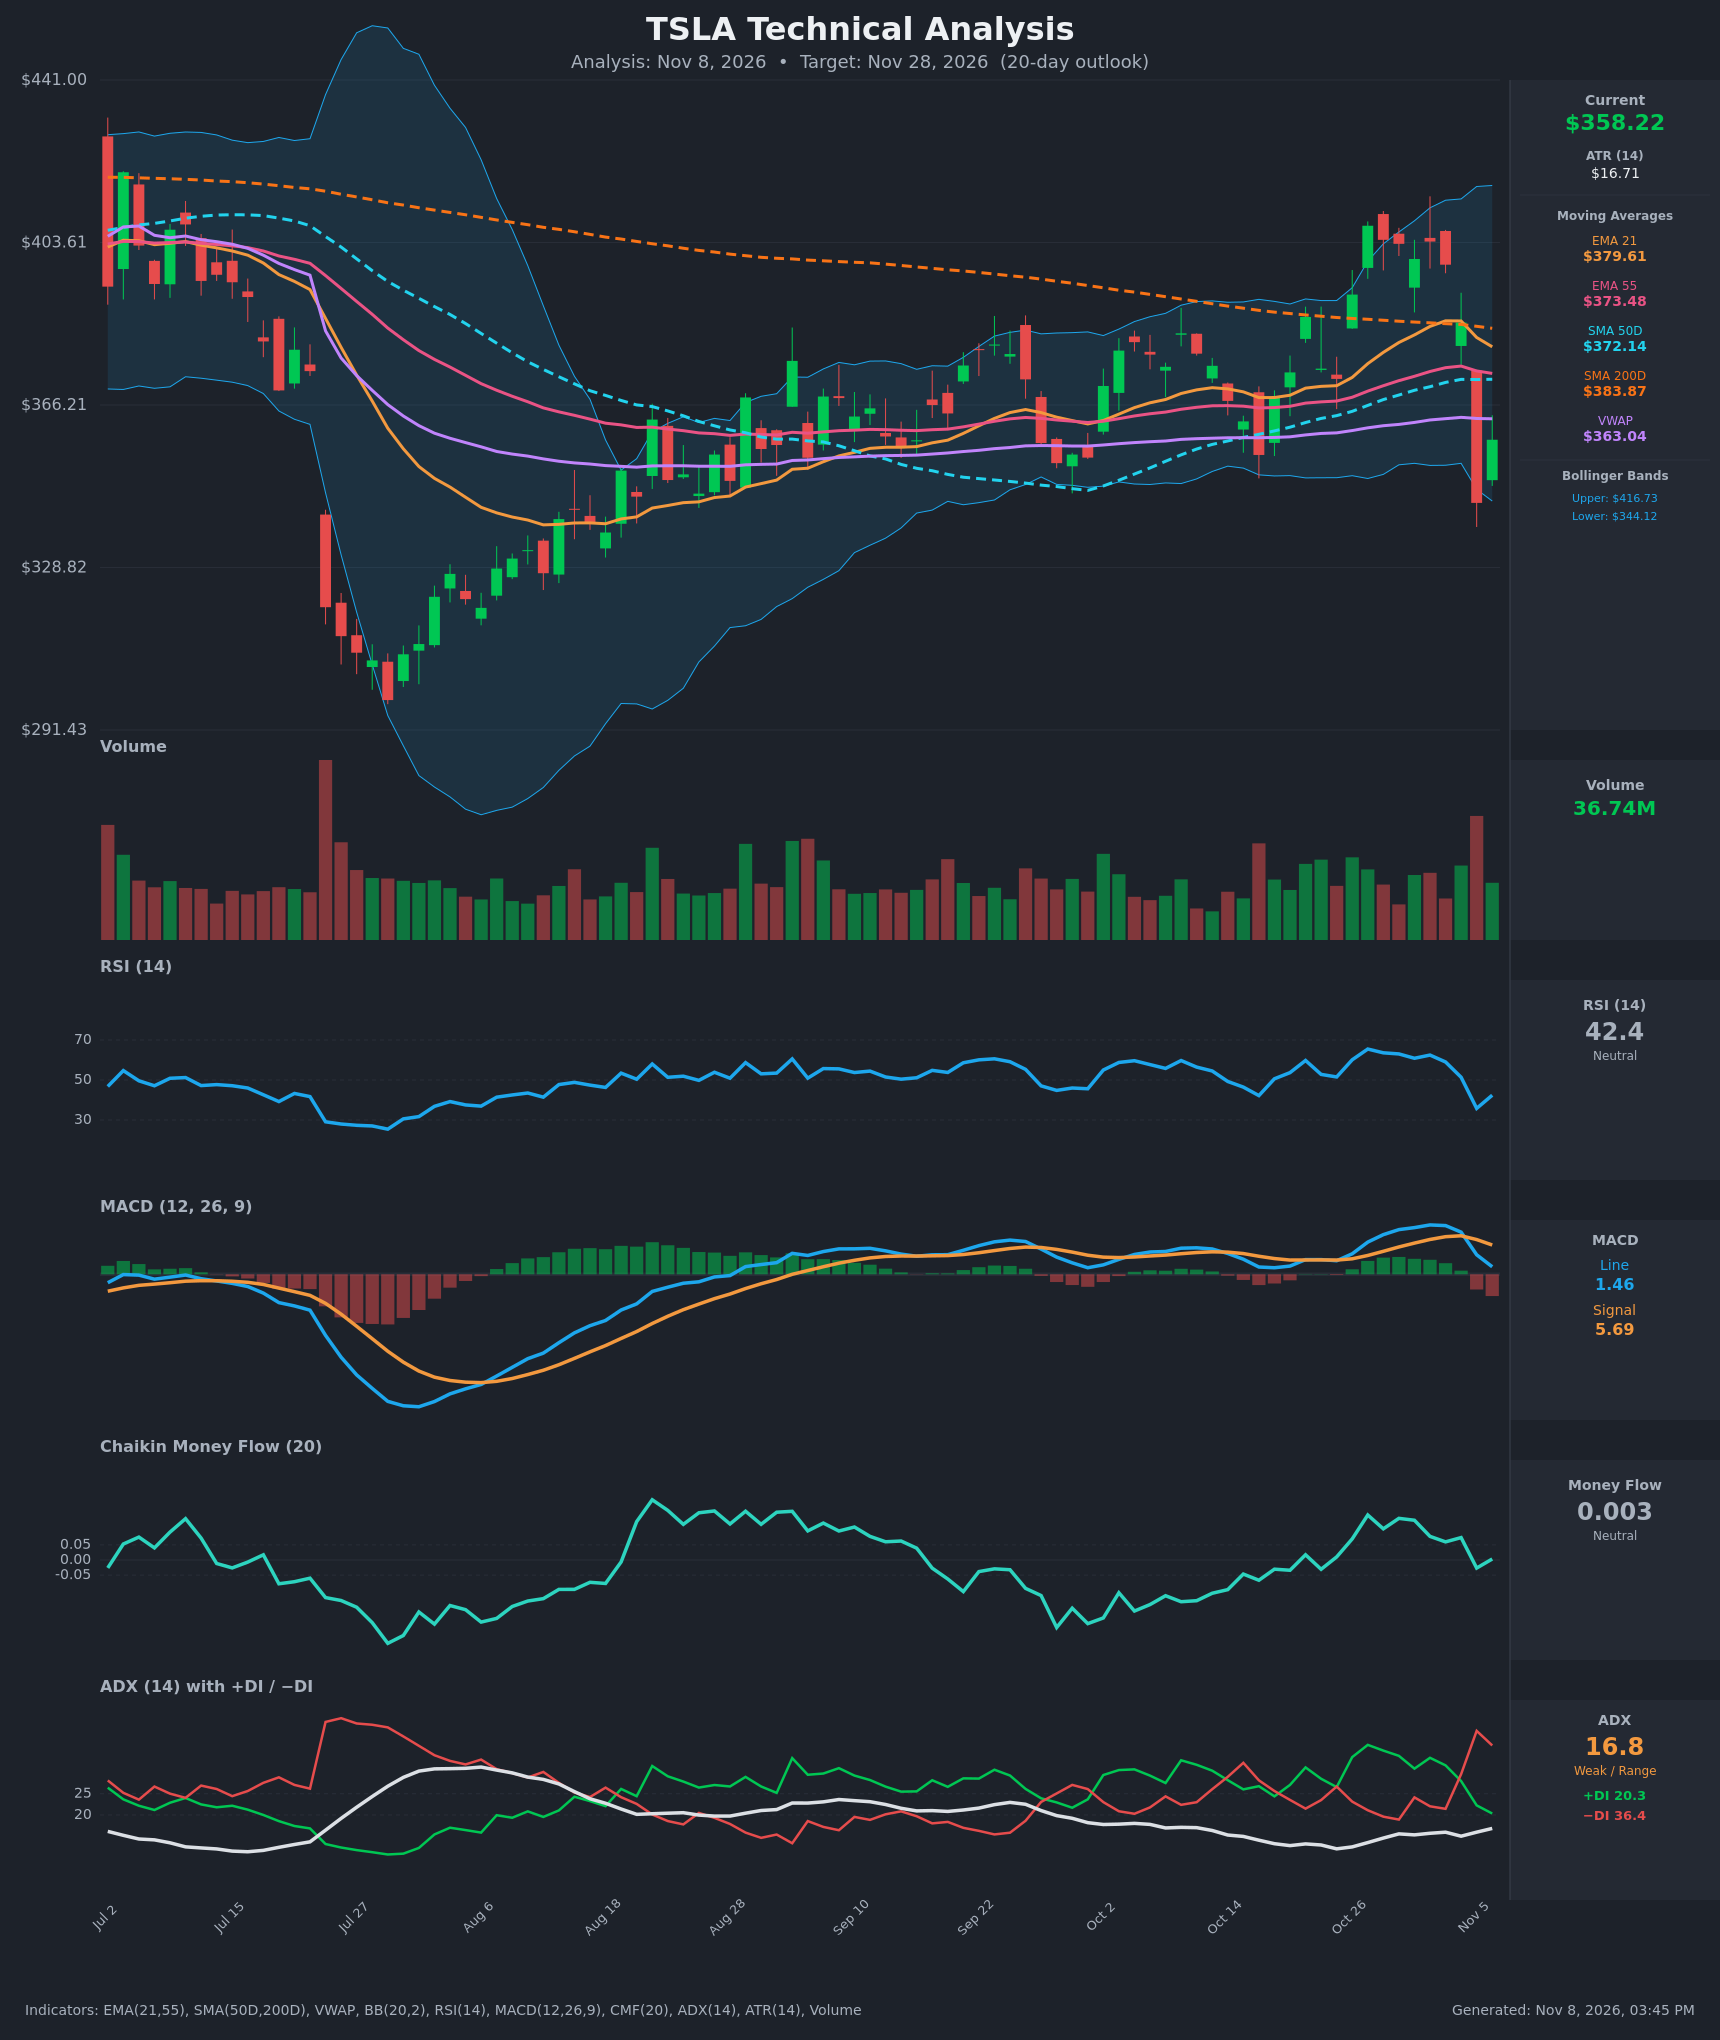
Analysis
TECHNICAL INDICATORS
- RSI (14): 42.39, down sharply from the low 60s in late October and bouncing off a 35.8 low on Nov 5. It sits below the 50 midline but is not oversold, so momentum is soft with a slight uptick. [Bearish]
- 20 EMA: The EMA 21 is $379.61, about 6% above the $358.22 price. The EMA 21 is rolling over (peak $385.59) and acts as overhead resistance. Price is also below the EMA 55 ($373.48) and the SMA 50D ($372.14). [Bearish]
- MACD: Line 1.46 is below Signal 5.69, a bearish crossover that occurred on Nov 5. The histogram is negative (about -4.2) and the line is falling fast toward zero. [Bearish]
- Bollinger Bands (20): Upper $416.73, lower $344.12, midline about $380. Price is in the lower third of the bands after a Nov 5 flush that pierced the lower band intraday and recovered. The bands are moderately wide, so volatility is normal to elevated. There is a mean-reversion bounce potential, but the midline is overhead. [Neutral]
- CMF (20): 0.003, inside the ±0.05 band. It has fallen from +0.149 on Oct 27, so buying pressure has faded without turning into outright distribution. [Neutral]
- ADX (14): 16.8 with −DI 36.4 above +DI 20.3. The trend is weak (<20), but the directional bias is clearly bearish after the DI crossover on Nov 4. ADX is ticking up (16.8 from 15.0), which suggests the bearish move could gain strength. [Weak Trend, Bearish Direction]
- Volume: 36.74M. The Nov 5 breakdown candle (-10.8%) came on the heaviest volume of the recent bars, a high-volume distribution day. The following green candle came on lower volume, so the bounce lacks conviction. [Bearish]
DIVERGENCES & TRENDS
- No clear divergence. RSI and MACD both confirm the price drop and made lower highs after the Oct 27 peak.
- The EMA 21 ($379.61) crossed above the EMA 55 ($373.48) in late October, but the spread is narrowing quickly (about $6 now vs about $10 on Nov 3). A bearish EMA crossover is likely within days if price stays below.
- SMA 50D ($372.14) remains below SMA 200D ($383.87), so no golden cross. The gap is narrowing, but price is below both, which keeps the long-term structure bearish.
- MACD crossed down on Nov 5, and −DI crossed above +DI on Nov 4, so both momentum and directional indicators have rolled bearish.
- Price lost VWAP ($363.04) and is trading about $4.80 below it, which is a minor sign of selling pressure.
- The Oct 21 to Nov 3 rally ($368 to $407) was a failed breakout above the $400 area, and the Nov 5 gap-down erased most of it. This looks like a bull trap.
CHART PATTERNS
- The price action since late September resembles a Bearish Double Top or a failed breakout. Highs near $407 (Oct 27) and about $404 (Oct 29 to Nov 3) failed at the SMA 200D and the upper Bollinger Band area, then broke down through the neckline near $385 to $370.
- The measured move from a top near $407 to a neckline near $370 is about $37, which projects toward roughly $333 if the neckline fails to be reclaimed. This is not a perfect textbook pattern.
- The wider structure since August is a range of roughly $345 to $407. Price is now near the lower portion, with the $344 to $345 area (lower band, Oct lows) as the key support.
- Overhead resistance clusters between $372 and $384 (SMA 50D, EMA 55, EMA 21, SMA 200D), which makes recovery difficult.
POTENTIAL SCENARIOS
- Scenario 1: Bearish Continuation Lower — Price fails to reclaim the VWAP and the $372 to $380 moving-average cluster, then rolls over as MACD and −DI stay bearish. Trigger: close below $344 (lower band and Nov 5 low area). Target: $325 to $335. Invalidation: daily close above $380 (EMA 21). (45% probability)
- Scenario 2: Neutral Range Bounce — Oversold relief after the heavy drop leads to choppy trade between the lower band and the moving-average cluster. Trigger: holds $344 to $350 and RSI stabilizes above 40. Target: $350 to $372. Invalidation: close above $380 or below $340. (30% probability)
- Scenario 3: Bullish Reversal Recovery — The Nov 5 flush proves a false breakdown, price reclaims VWAP and the EMAs, and it retests the prior highs. Trigger: close above $373 to $380 on rising volume with a MACD turn. Target: $395 to $405. Invalidation: rejection at $373 and a close back under $350. (25% probability)
PRICE TARGETS
- Target Price: $349.00 (20-day, a modest drift lower as the moving-average cluster caps rallies)
- Expected Range: $318.00 to $370.00 (width $52, about 14.5% of current price, consistent with the 14-21 day guidance of about 8-12% extended for TSLA's high ATR of $16.71)
- Key Levels: Support at $344.00, Resistance at $372.00
OVERALL BIAS
OVERALL BIAS: BEARISH - A bearish MACD crossover, −DI well above +DI, a high-volume breakdown candle, and price below all key moving averages and VWAP outweigh the weak ADX and neutral CMF. Rallies face a dense resistance cluster at $372 to $384, and the failed breakout above $400 points to a lower range.
This is educational analysis and not financial advice.