TLT 20-day bullish forecast — Nov 8, 2026
- Bias: Bullish
- Timeframe: 20 days (made Nov 8, 2026, target date Nov 27, 2026)
- Price at analysis: $81.92
- Price target: $82.90
- Expected range: $78.40 – $86.20
- Result: Pending — graded after the close on Nov 27, 2026
Get a free AI analysis of TLT today
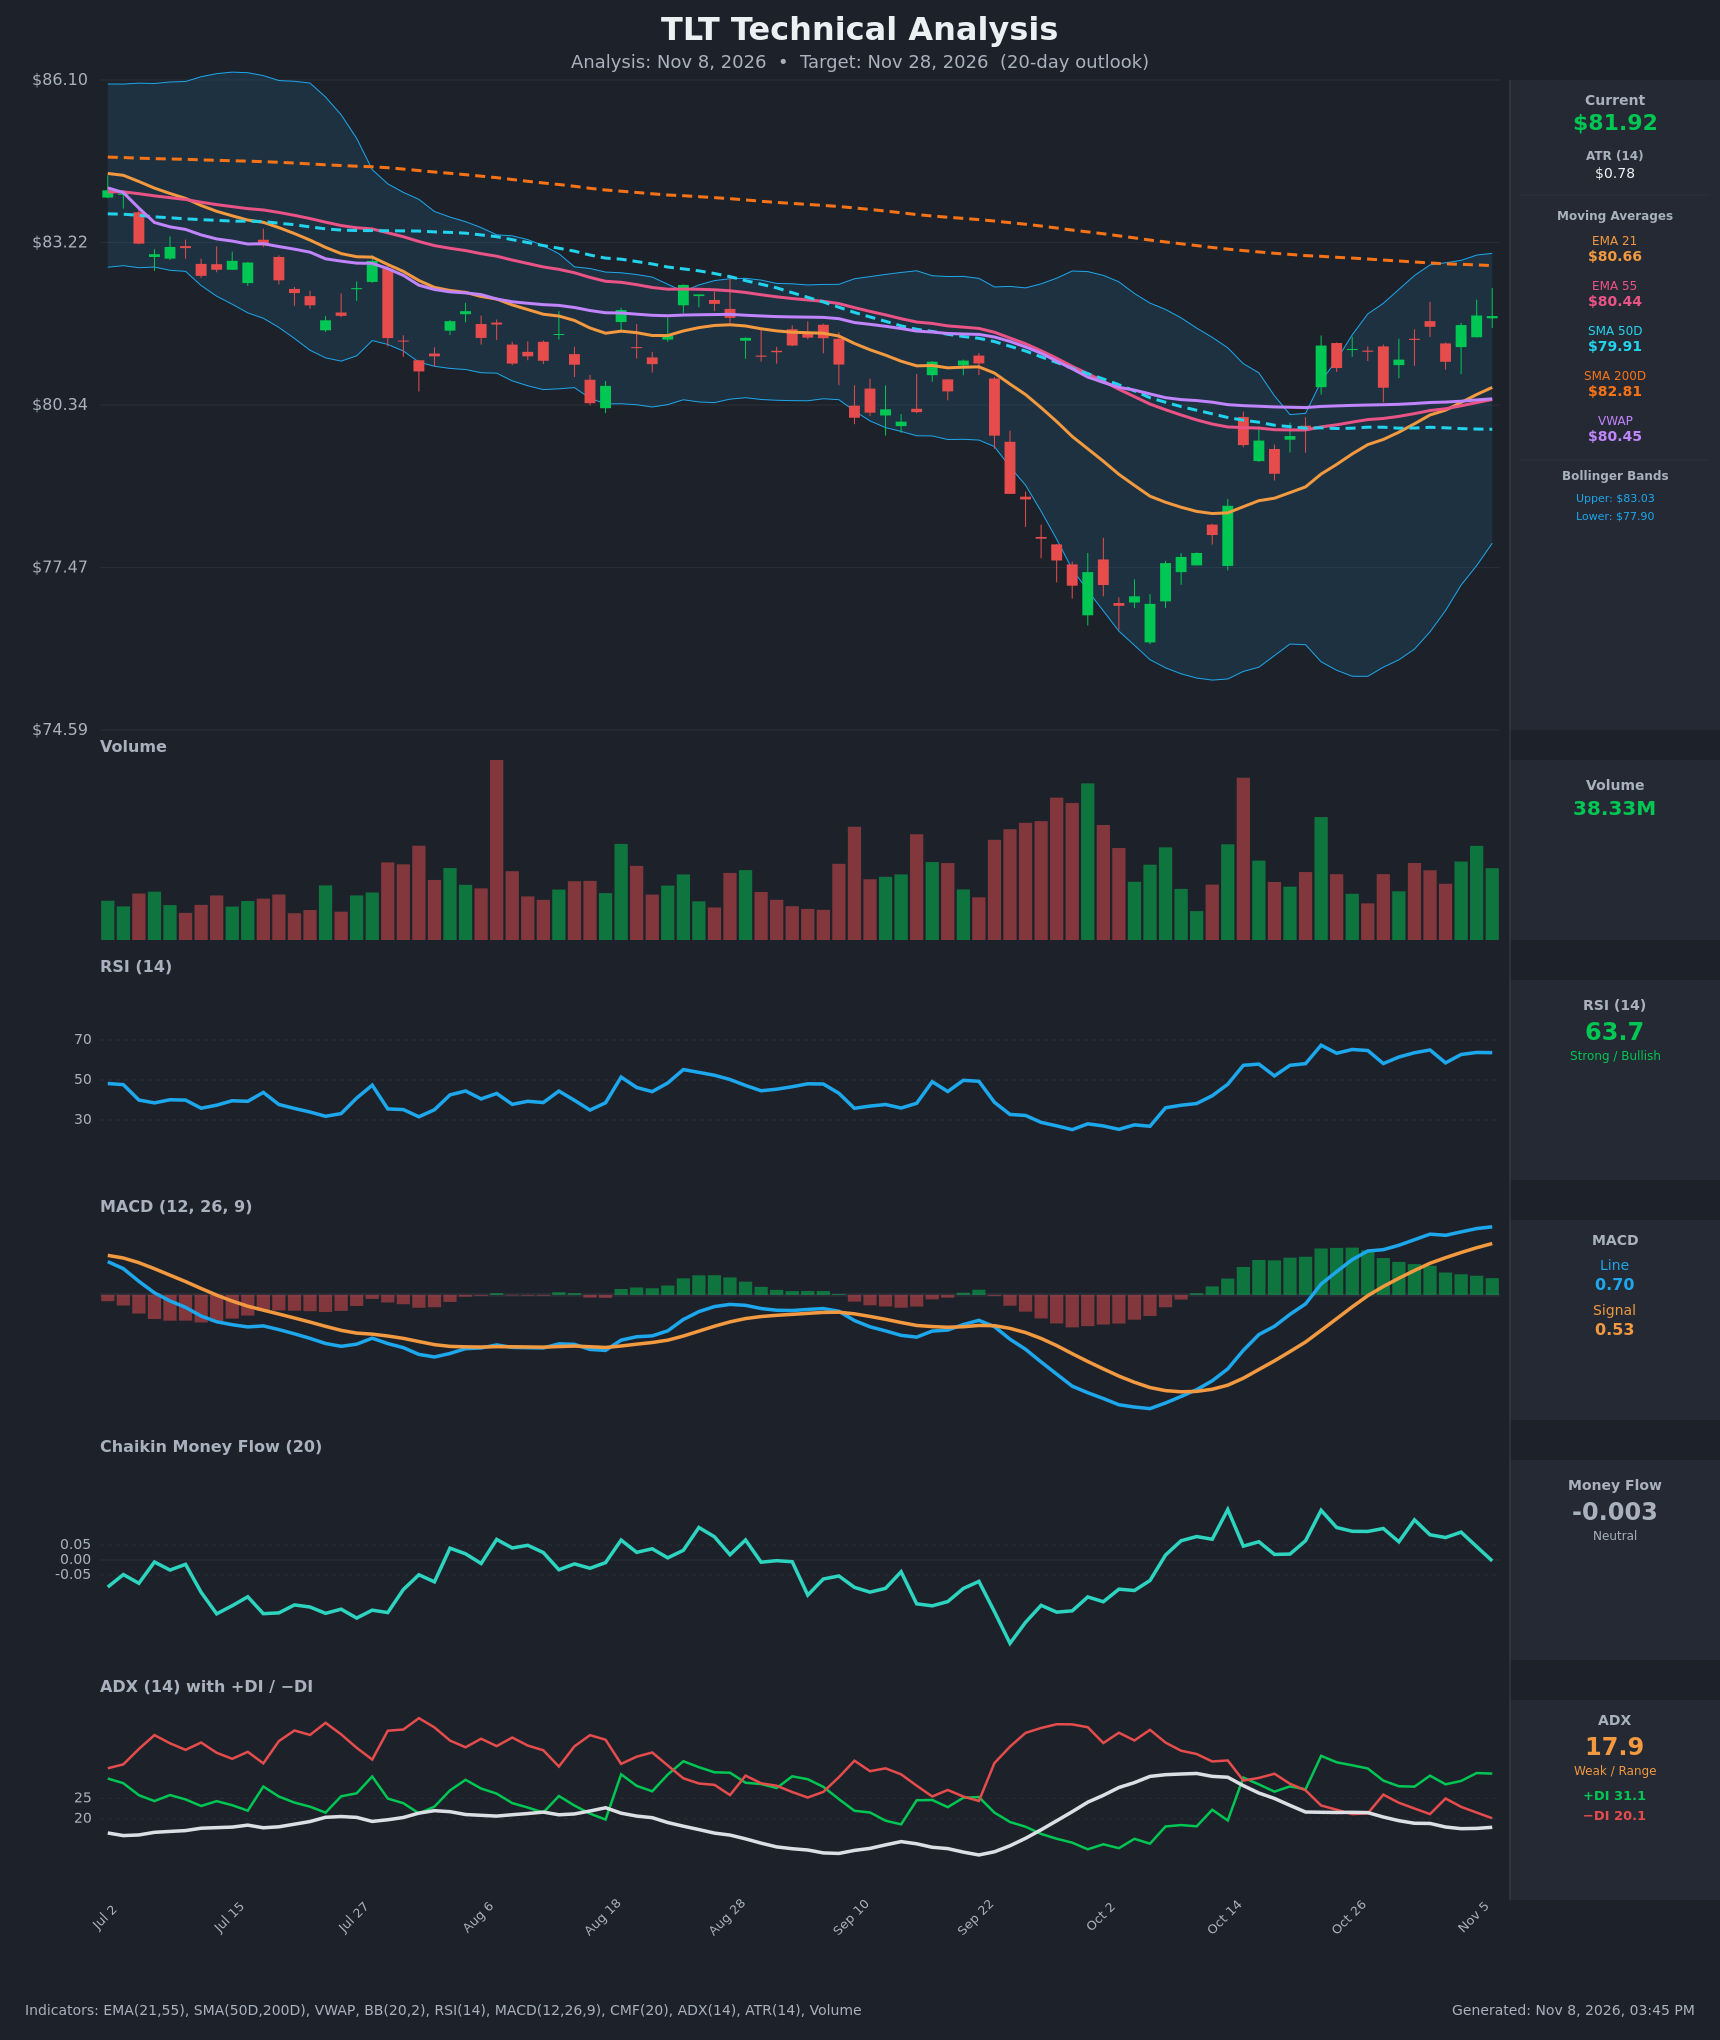
Analysis
TECHNICAL INDICATORS
- RSI (14): 63.66, up from the low 50s on Oct 19 and holding in the 58-67 band for two weeks. Momentum is strong but not yet overbought (>70). It has stalled below the Oct 22 peak of 67.4, so the push is losing a little energy. [Bullish]
- 20 EMA (EMA 21): $80.66, with price at $81.92 about 1.6% above it. EMA21 crossed above EMA55 ($80.44) around Nov 3-5 and is rising, so it now acts as dynamic support. [Bullish]
- MACD: Line 0.70 is above signal 0.53, with a positive histogram of +0.17. The bullish crossover happened on Oct 28, and both lines are above zero and rising. The histogram has plateaued around +0.15 to +0.20, so acceleration is fading. [Bullish]
- Bollinger Bands (20): Upper $83.03, lower $77.90, with price in the upper third of the band, about $1.1 below the upper band. Bands are widening after the October volatility. The price is not extended, but the upper band and SMA200 cluster at $82.8-83.0 caps the near-term upside. [Neutral]
- CMF (20): -0.003, fading from +0.13 on Oct 30 to zero. This is neutral, and the fade means buying pressure has dried up during the last leg higher. That is a mild warning for a breakout attempt. [Neutral]
- ADX (14): 17.9 and drifting lower from 25 in mid-October, so the trend is weak. +DI (31.1) is clearly above −DI (20.1), so bulls hold directional control, but the low ADX means follow-through is unproven. [Weak Trend, Bullish direction]
- Volume: 38.33M, with recent up days (Oct 22, Nov 4-5) printing average-to-above-average green bars and no heavy distribution days. This is healthy for the rebound, though not a surge. [Mildly Bullish]
Other levels:
- VWAP: $80.45, below price, which is supportive.
- SMA 50: $79.91, below price, which is supportive.
- SMA 200: $82.81, above price, and the main overhead hurdle.
- Death cross: SMA50 remains below SMA200, so the long-term trend is still technically down until price reclaims the 200-day.
DIVERGENCES & TRENDS
- Price is making higher highs ($81.40 → $81.93) while RSI is stuck at 63-65 and CMF has fallen to zero. This is a minor momentum and volume-flow divergence, so the advance is less supported by buying pressure.
- MACD and the DI spread confirm the bullish bias, but falling ADX (25 → 17.9) shows the move is more of a grind than a trend.
- There was a bullish MACD crossover on Oct 28 and an EMA21/EMA55 bullish crossover in early November.
- There has been a V-shaped recovery from the ~$76.3 low (early-to-mid October). Price reclaimed the 21/55 EMAs, SMA50 and VWAP.
- Price is still below the declining SMA200 ($82.81), and SMA50 is below SMA200, so a death-cross regime persists.
CHART PATTERNS
- Bullish Double Bottom / Falling Wedge reversal: Price carved two lows near $76.3-76.5 in early-to-mid October after a multi-month descending channel. It then broke above the neckline area of $80.3-81, which fits the double bottom / falling wedge breakout from the reference diagram.
- Measured move: neckline ~$80.8 minus the low ~$76.4 is about $4.4, projecting to ~$85.2. That is an extended target and would require clearing the SMA200 first.
- Resistance zone: SMA200 at ~$82.8 and the upper Bollinger Band at ~$83.0 form a confluence barrier. This is the first test for the pattern.
- Short-term consolidation: Price is making a tight sideways pause just under resistance (Oct 22 - Nov 6: $80.65-$81.93). This looks like a bullish pennant/flag, which is a continuation pattern.
POTENTIAL SCENARIOS
- Scenario 1: Bullish SMA200 Breakout — Price consolidates above EMA21, then clears the SMA200/upper band confluence as the double-bottom breakout extends. Trigger: daily close above $83.05 with volume above ~40M and CMF back above +0.05. Target: $84.50-$85.20 (measured move). Invalidation: daily close below $80.40 (EMA55/VWAP). (50% probability)
- Scenario 2: Bearish Rejection at SMA200 — Fading CMF and weak ADX lead to a rejection at $82.8-83.0, with price falling back to retest support. Trigger: failure at $83 followed by a close below EMA21 ($80.66). Target: $79.90-$80.20 (SMA50), with an extension to $78.50 if it breaks. Invalidation: close above $83.10. (30% probability)
- Scenario 3: Neutral Range Grind — Weak ADX keeps price oscillating between EMA21 and the SMA200. Trigger: no daily close beyond $80.40 or $83.05. Target: $80.80-$82.80. Invalidation: a decisive close outside that band. (20% probability)
PRICE TARGETS
For a 20-day horizon, the expected range width is ~$7.80, or ~9.5% of the current price. That fits the 8-12% guidance for 14-21 days and is much wider than a 2-3 day range. The width is also consistent with ATR $0.78 × √20 ≈ $3.5 (one standard deviation) on each side.
- Target Price: $82.90 (20 trading days)
- Expected Range: $78.40 to $86.20
- Key Levels: Support at $80.45 (EMA55/VWAP, with EMA21 at $80.66 just above), Resistance at $82.81 (SMA200, with the upper Bollinger Band at $83.03)
OVERALL BIAS
OVERALL BIAS: BULLISH - Price is above all short-term averages and VWAP with a bullish MACD crossover, +DI over −DI, and a double-bottom/falling-wedge breakout. Conviction is modest because ADX is weak, CMF is fading to zero, and the SMA200 at $82.81 is overhead resistance.
This is educational analysis and not financial advice.