TQQQ 20-day bearish forecast — Nov 8, 2026
- Bias: Bearish
- Timeframe: 20 days (made Nov 8, 2026, target date Nov 27, 2026)
- Price at analysis: $52.25
- Price target: $50.00
- Expected range: $47.75 – $54.00
- Result: Pending — graded after the close on Nov 27, 2026
Get a free AI analysis of TQQQ today
Analysis
TECHNICAL INDICATORS
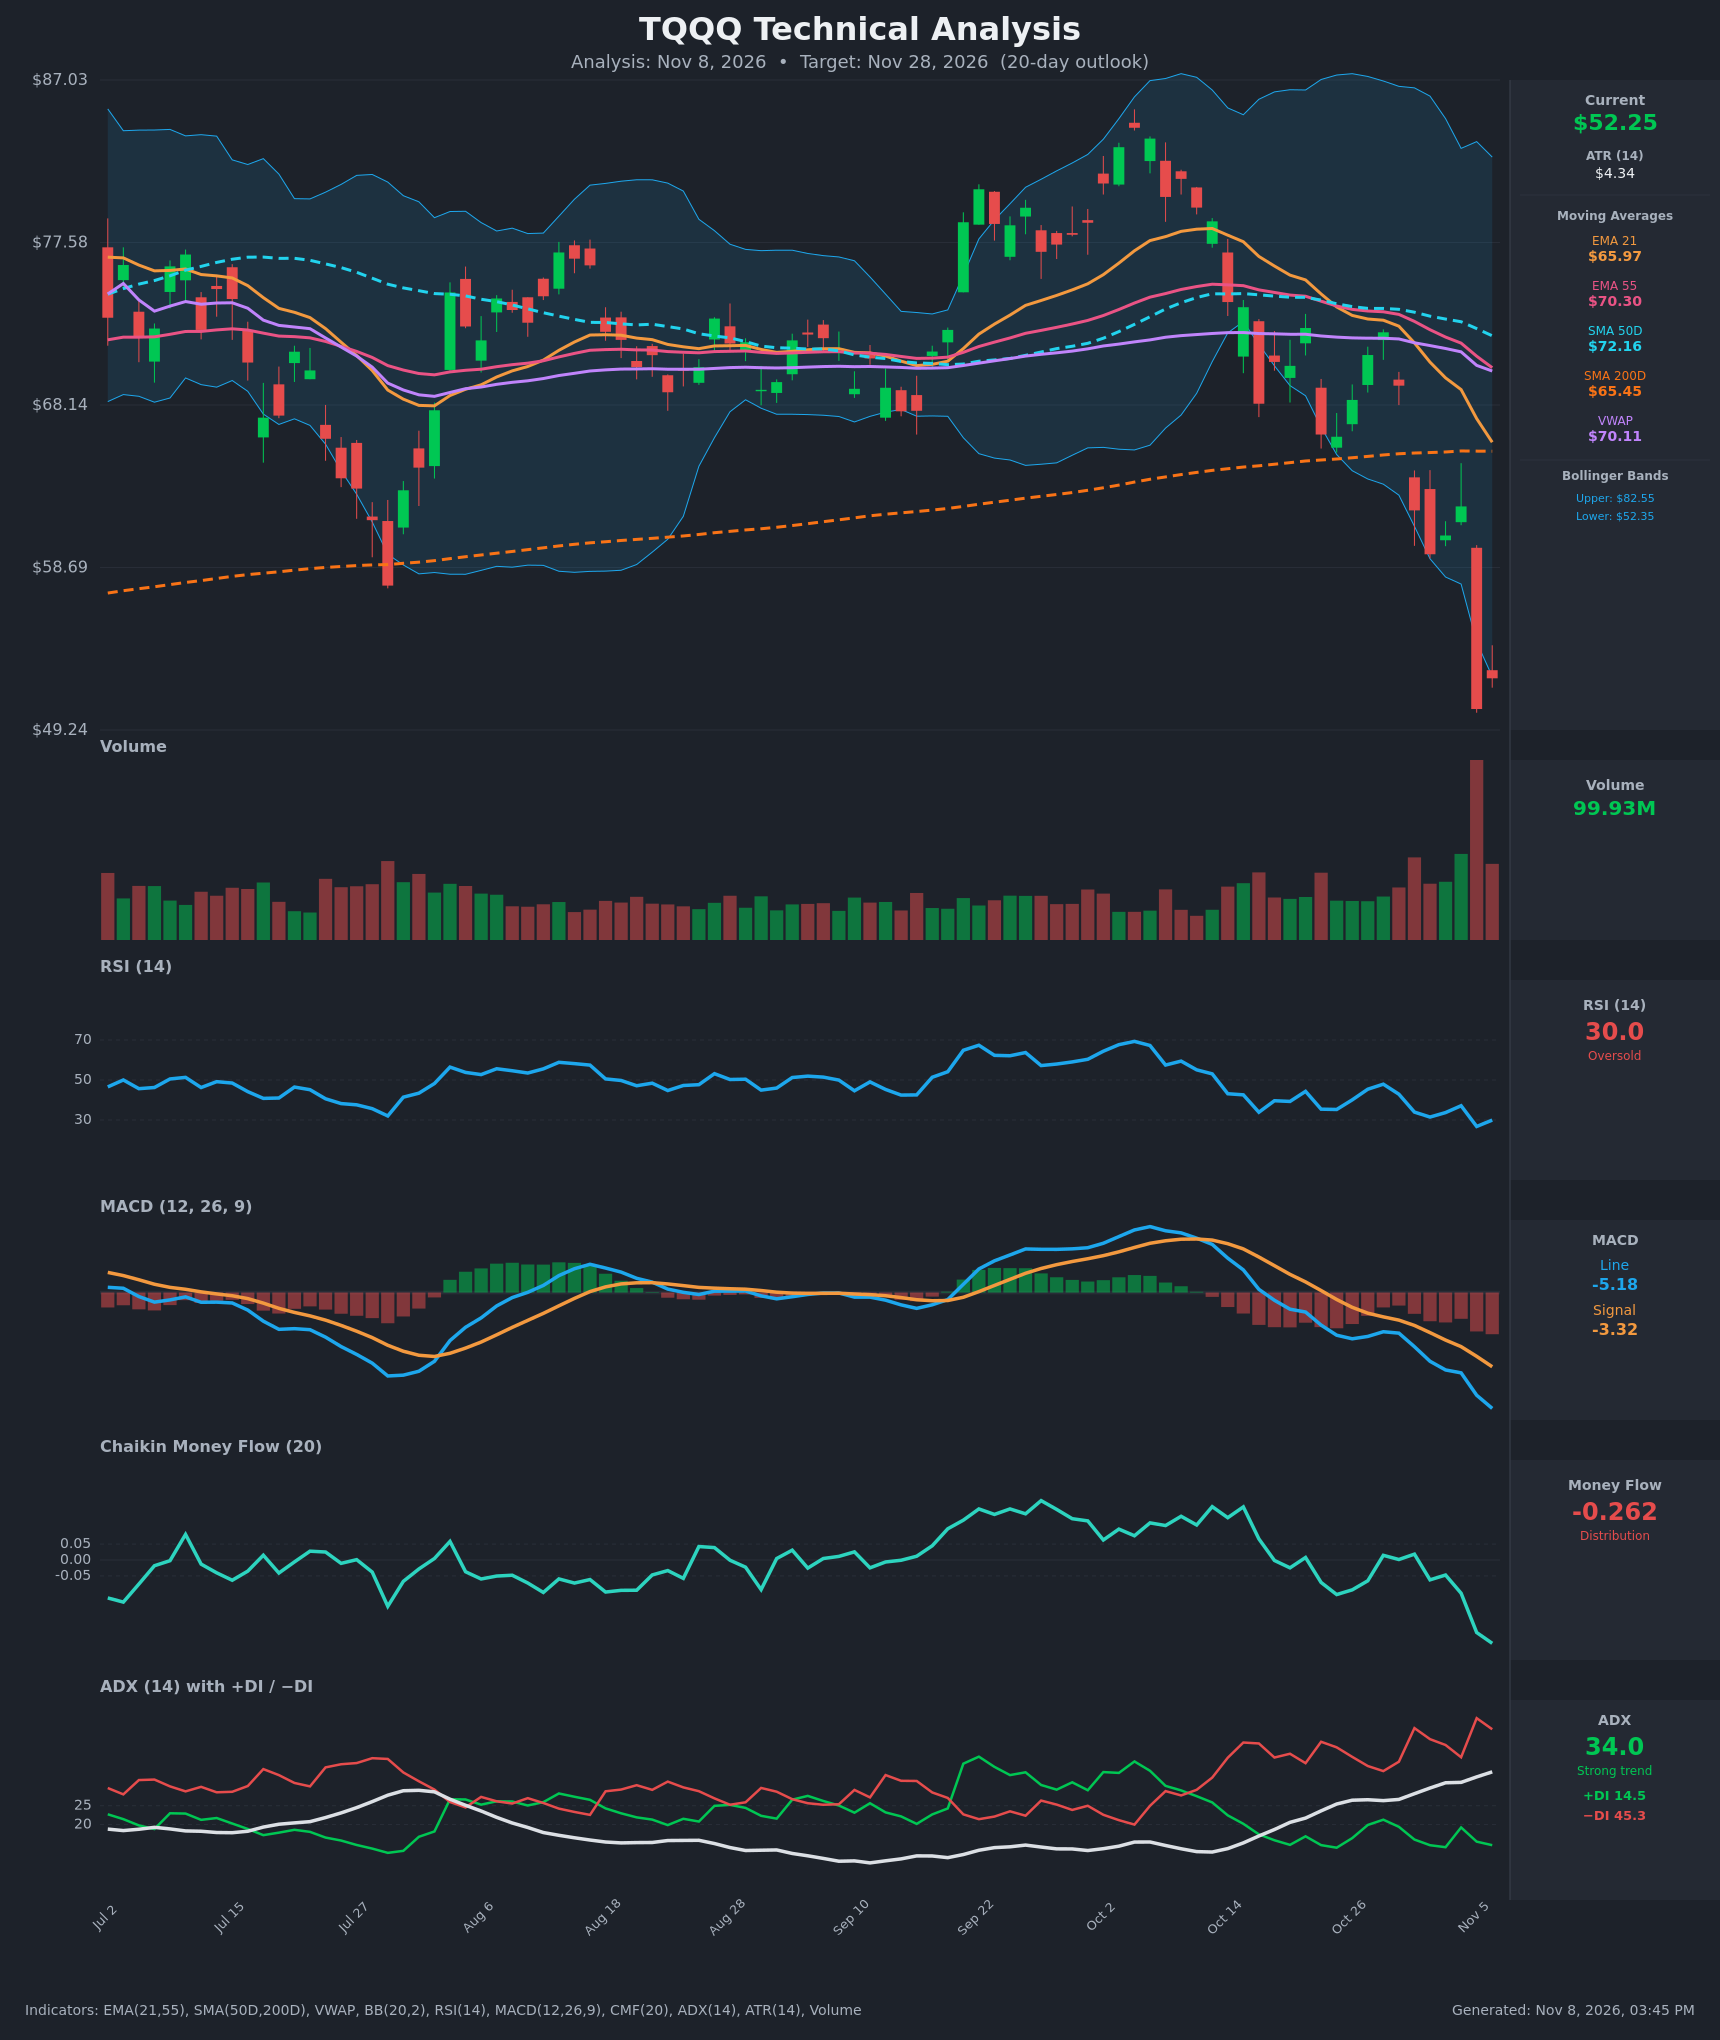
- RSI (14): 29.96, at the oversold threshold after hitting 26.8 on Nov 5. It has fallen from about 48 on Oct 28 to 30, a sharp downtrend in momentum. The small uptick from 26.8 is not yet a reversal. In strong downtrends RSI can stay oversold for a long time. [Bearish]
- 20 EMA: The 21 EMA is $65.97 and price is $52.25, about 20.8% below it, so it acts as heavy overhead resistance. The EMA is falling steeply. The 21 EMA crossed below the 55 EMA ($70.30) around Oct 23, a bearish crossover that is still widening. [Bearish]
- MACD: The line is -5.18 and the signal is -3.32. The line crossed below the signal around Oct 22 and the gap keeps widening, with the histogram at about -1.86 and still growing. The line is at its lowest level on the chart. [Bearish]
- Bollinger Bands (20): The upper band is $82.55 and the lower band is $52.35. Price at $52.25 sits just below the lower band after a very wide band expansion. This shows a strong downtrend (walking the band), and it is also stretched enough to invite a relief bounce. A close back inside the band would be the first sign of stabilization. [Bearish]
- CMF (20): -0.262, well below -0.05 and the weakest reading on the chart. It has fallen from about +0.02 at the end of October, which shows persistent, heavy selling pressure. [Distribution]
- ADX (14): 34.0 and rising from 18.7 on Oct 19, so the trend is strong and strengthening. −DI is 45.3 against +DI at 14.5, a wide bearish spread with sellers firmly in control. The −DI has been on top since Oct 14. [Strong Trend – Bearish]
- Volume: 99.93M. The Nov 5 bar (-19%) was the largest of the entire period, and a few days of heavy selling volume preceded it. This is a capitulation-style flush, but the follow-through volume has been lower and has not yet shown buyers absorbing supply. [Bearish with capitulation risk]
DIVERGENCES & TRENDS
- Divergences: There is no confirmed bullish divergence. The Nov 6 RSI of 30.0 is above the Nov 5 low of 26.8, but price has only bounced about 3.5% off its low. MACD and CMF are making new lows alongside price, which confirms the downtrend rather than diverging from it.
- Moving averages:
- A bearish EMA 21/55 crossover occurred around Oct 23.
- Price is below the 21 EMA, 55 EMA, 50D SMA ($72.16), VWAP ($70.11) and 200D SMA ($65.45).
- The 200D SMA was lost on Oct 30 with a gap down and has not been reclaimed.
- No death cross yet, since the 50D ($72.16) is still above the 200D ($65.45). The 50D is rolling over and could eventually threaten one.
- Indicator trends: ADX is rising with −DI dominant, MACD histogram is expanding negatively, and CMF is falling. All trend-following tools are aligned bearish.
- Counterpoint: Price is about 38% below the Oct peak near $85, RSI is oversold, and price is at the lower Bollinger Band after a volume spike. That raises the odds of a sharp relief bounce, though not necessarily a trend reversal.
CHART PATTERNS
- Bearish Double Top (completed): Peaks near $72.6 (Oct 21) and $72.4 (Oct 28) formed a double top with a neckline around $66.3. The neckline broke on Oct 30. The measured move from a roughly $6 pattern height targets about $60, and price has already overshot it. This signals a strong, impulsive reversal.
- Lower highs from the Oct peak: The Oct high near $85 followed by lower highs near $77 and $72 shows a distribution and breakdown structure.
- Possible bear flag: The weak bounces between Oct 26 and Nov 4 ($59–$62) look like a bear flag or pennant. The breakdown on Nov 5 resolved it downward.
- Capitulation candle: The oversized red candle on huge volume sets $49.24 (intraday low) as key support. A stall above it would suggest short-term exhaustion rather than a reversal.
POTENTIAL SCENARIOS
- Scenario 1: Bearish Trend Continuation — Strong ADX, −DI dominance, negative MACD, and CMF distribution favor sellers. Any bounce stalls below the broken 200D SMA and former support, and price grinds lower. Trigger: a close below $49.24 or a failed bounce below $56. Target: $47.00–$50.00. Invalidation: a daily close above $59.50 with expanding volume. (50% probability)
- Scenario 2: Bullish Oversold Relief Bounce — The capitulation volume, RSI near 30, and the stretch below the lower Bollinger Band trigger a mean-reversion rally toward the Nov 2–5 gap area. Trigger: a close back above the lower band and $56 with CMF turning up. Target: $57.00–$60.00. Invalidation: a break below $49.24. (35% probability)
- Scenario 3: Neutral Basing Range — Price stabilizes between the capitulation low and the $55–$56 area as selling exhausts and ADX peaks. Trigger: several narrow-range sessions with declining volume. Target: $50.00–$55.00. Invalidation: a close outside $49.24–$56.00. (15% probability)
PRICE TARGETS
- Target Price: $50.00 (20-day, a roughly 4.3% decline from $52.25)
- Expected Range: $47.75 to $54.00 (width of $6.25, about 12% of current price, consistent with the 14–21 day guidance)
- Key Levels: Support at $49.24, Resistance at $59.50
OVERALL BIAS
OVERALL BIAS: BEARISH - Every trend and momentum indicator (ADX at 34 with −DI dominant, MACD widening below signal, CMF at -0.26, price under all key moving averages after a double-top breakdown) points lower. The oversold RSI and lower-band touch argue for a sharp counter-trend bounce, but not enough to override the trend evidence.
This is educational analysis and not financial advice.