WMT 20-day bullish forecast — Nov 8, 2026
- Bias: Bullish
- Timeframe: 20 days (made Nov 8, 2026, target date Nov 27, 2026)
- Price at analysis: $125.52
- Price target: $128.00
- Expected range: $120.00 – $132.50
- Result: Pending — graded after the close on Nov 27, 2026
Get a free AI analysis of WMT today
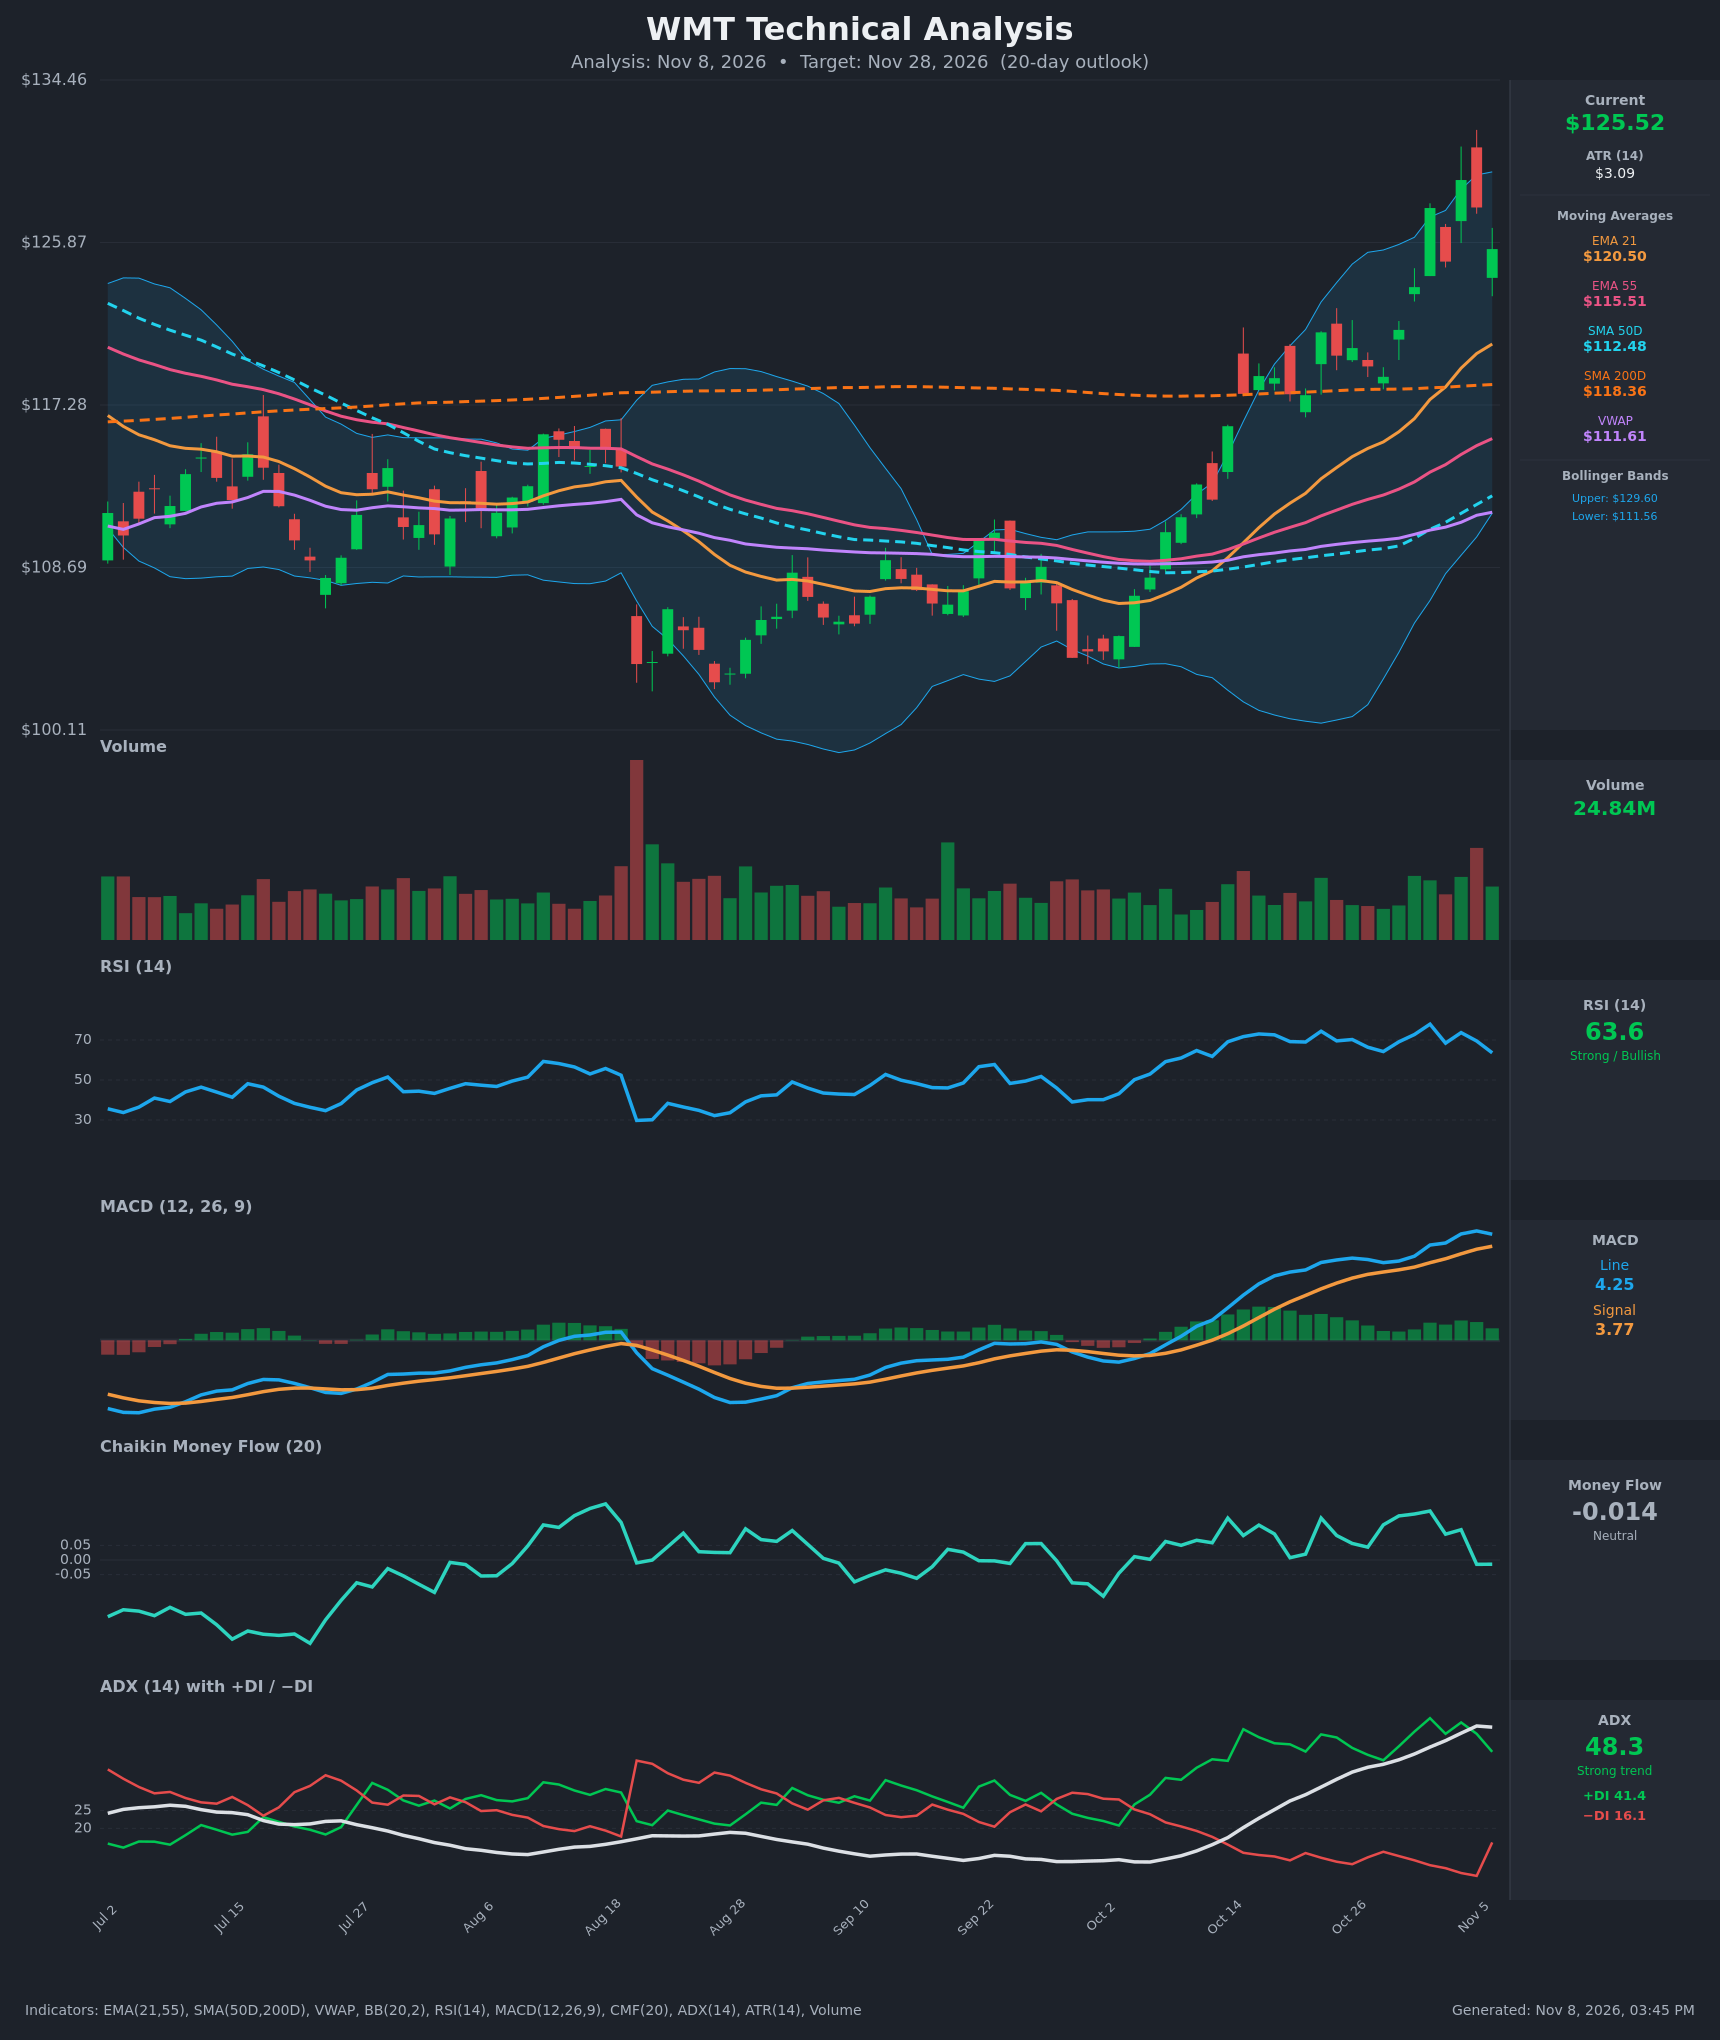
Analysis
TECHNICAL INDICATORS
- RSI (14): 63.6, down from a 77.9 peak on Nov 2 and 73.7 on Nov 4. It has cooled out of overbought but is still in bullish territory above 50. Momentum is fading while price holds near highs. [Bullish]
- 20 EMA: EMA 21 is $120.50 and rising steeply, with price about 4% above it. EMA 21 crossed above EMA 55 ($115.51) earlier, and the stack of price > EMA21 > EMA55 is bullish. The EMA 21 is the first dynamic support on a pullback. [Bullish]
- MACD: The line (4.25) is above the signal (3.77), so the bullish crossover is intact. The histogram is positive (~0.48) but has shrunk from ~0.73 on Nov 5, and the line ticked down for the first time in this leg. The trend is bullish but momentum is flattening. [Bullish]
- Bollinger Bands (20): Upper is $129.60, lower is $111.56, and the mid-band is roughly $120.6. Price ($125.52) sits in the upper third after tagging the upper band at $129.17. The bands are wide after the expansion, so the move is extended. A walk along the upper band is bullish, but a retreat toward the mid-band is common. [Neutral]
- CMF (20): -0.014, down from +0.168 on Nov 2 and just below zero. It is inside the ±0.05 neutral zone. The rally lacks confirming accumulation, which is a mild warning. [Neutral]
- ADX (14): 48.3, a very strong trend, but it has flattened (48.6 → 48.3). +DI is 41.4 and −DI is 16.1, so bulls are on top. However, +DI fell from 50.8 and −DI jumped from 6.7 to 16.1 in a single bar, a sign of the first real selling in weeks. Readings this high often precede consolidation. [Strong Trend – Bullish, possibly exhausting]
- Volume: 24.84M, in line with average. Volume was elevated on the big up days (Nov 2–4) and the pullback bars show no distribution spike. The Nov 4 reversal day printed higher volume, though. [Neutral to mildly Bullish]
Other trend context:
- Price is above SMA 200 ($118.36) and well above SMA 50 ($112.48) and VWAP ($111.61), which is a long-term bullish reclaim.
- The golden cross has not happened yet: SMA 50 is still below SMA 200 by about $5.9, but the gap is closing.
DIVERGENCES & TRENDS
- RSI divergence: Price made a higher high at $129.17 on Nov 4, while RSI peaked earlier at 77.9 (Nov 2). The Nov 4 reading of 73.7 was a lower high, which is a mild bearish divergence.
- CMF divergence: CMF has fallen from +0.17 to roughly -0.01 while price stayed near highs, which points to fading buying pressure.
- MACD histogram: It is shrinking after peaking, which signals decelerating momentum. There is no bearish crossover yet.
- ADX/DI: ADX has plateaued near 48, and −DI jumped while +DI is rolling over, so some profit-taking has started. +DI is still far above −DI, so there is no trend change.
- Moving averages: EMA 21/55 are rising and widening, price is above SMA 200, and SMA 50 is turning up toward SMA 200 (a potential golden cross later).
- Price action: Last two bars were lower closes ($127.72 → $125.52) after the $129.17 high, forming a short-term pullback from the Bollinger upper band.
CHART PATTERNS
- Dominant structure: A strong, orderly uptrend from the early-October low (~$104) to $129 after a V-shaped recovery. This resembles a broader bullish reversal, with price reclaiming the 200-day SMA.
- Near-term candidate: A Bullish Flag / Pennant (continuation) is forming. The pole is the Oct 30 – Nov 4 surge, and the shallow pullback on lower closes is the flag. Measured move: pole of about $10 (from ~$119 to $129) added to a breakout above $129.6 gives roughly $138–139 as an extended target. That is beyond the 20-day horizon, so I target a partial move only.
- Counter-pattern: Highs at $127.69 and $129.17 with a dip between them could be read as a small Bearish Double Top. It would be confirmed only on a close below ~$124.86, and then below EMA 21 ($120.50). The double-top measured move would reach roughly $120–121.
- The pattern evidence slightly favors continuation, since the pullback is shallow and the trend is strong.
POTENTIAL SCENARIOS
- Scenario 1: Bullish Trend Continuation — The pullback holds above the $122–$124 area and buyers re-engage, with price breaking above the recent $129.17 high and the upper Bollinger Band. The flag/pennant resolves upward and the golden cross approaches. Trigger: Daily close above $129.60 with CMF back above +0.05. Target: $128–$132.50. Invalidation: Daily close below $120.50 (EMA 21). (50% probability)
- Scenario 2: Bearish Pullback to EMA 21 / Double-Top Completion — RSI divergence and weak CMF lead to a mean reversion as the extended price (+4% above EMA 21) retraces toward the mid-band and EMA 21. Trigger: Close below $124.86, then below $122. Target: $120.50–$118.40 (EMA 21 / SMA 200 zone). Invalidation: Reclaim of $127.70 on volume. (30% probability)
- Scenario 3: Neutral Consolidation — ADX cools from 48 as price digests the gains, ranging between EMA 21 support and the $129 high. Trigger: Several sessions of narrow range with falling ADX. Target: $122–$128 range. Invalidation: Close outside $120.50–$129.60. (20% probability)
PRICE TARGETS
- Target Price: $128.00 (20-day horizon, about +2.0% from $125.52)
- Expected Range: $120.00 to $132.50 (width $12.50, about 10% of current price, in line with the 14–21 day guidance)
- Key Levels: Support at $120.50 (EMA 21, with $118.36 SMA 200 below it), Resistance at $129.17 (recent high, with the upper Bollinger Band at $129.60)
OVERALL BIAS
OVERALL BIAS: BULLISH - Price is in a strong uptrend (ADX 48, +DI far above −DI, price above all key moving averages including SMA 200, MACD above signal). However, the RSI and CMF divergences point to a near-term digestion or pullback toward EMA 21 before any further upside, so conviction is moderate.
This is educational analysis and not financial advice.