XLE 20-day bearish forecast — Nov 8, 2026
- Bias: Bearish
- Timeframe: 20 days (made Nov 8, 2026, target date Nov 27, 2026)
- Price at analysis: $61.62
- Price target: $60.20
- Expected range: $57.30 – $63.60
- Result: Pending — graded after the close on Nov 27, 2026
Get a free AI analysis of XLE today
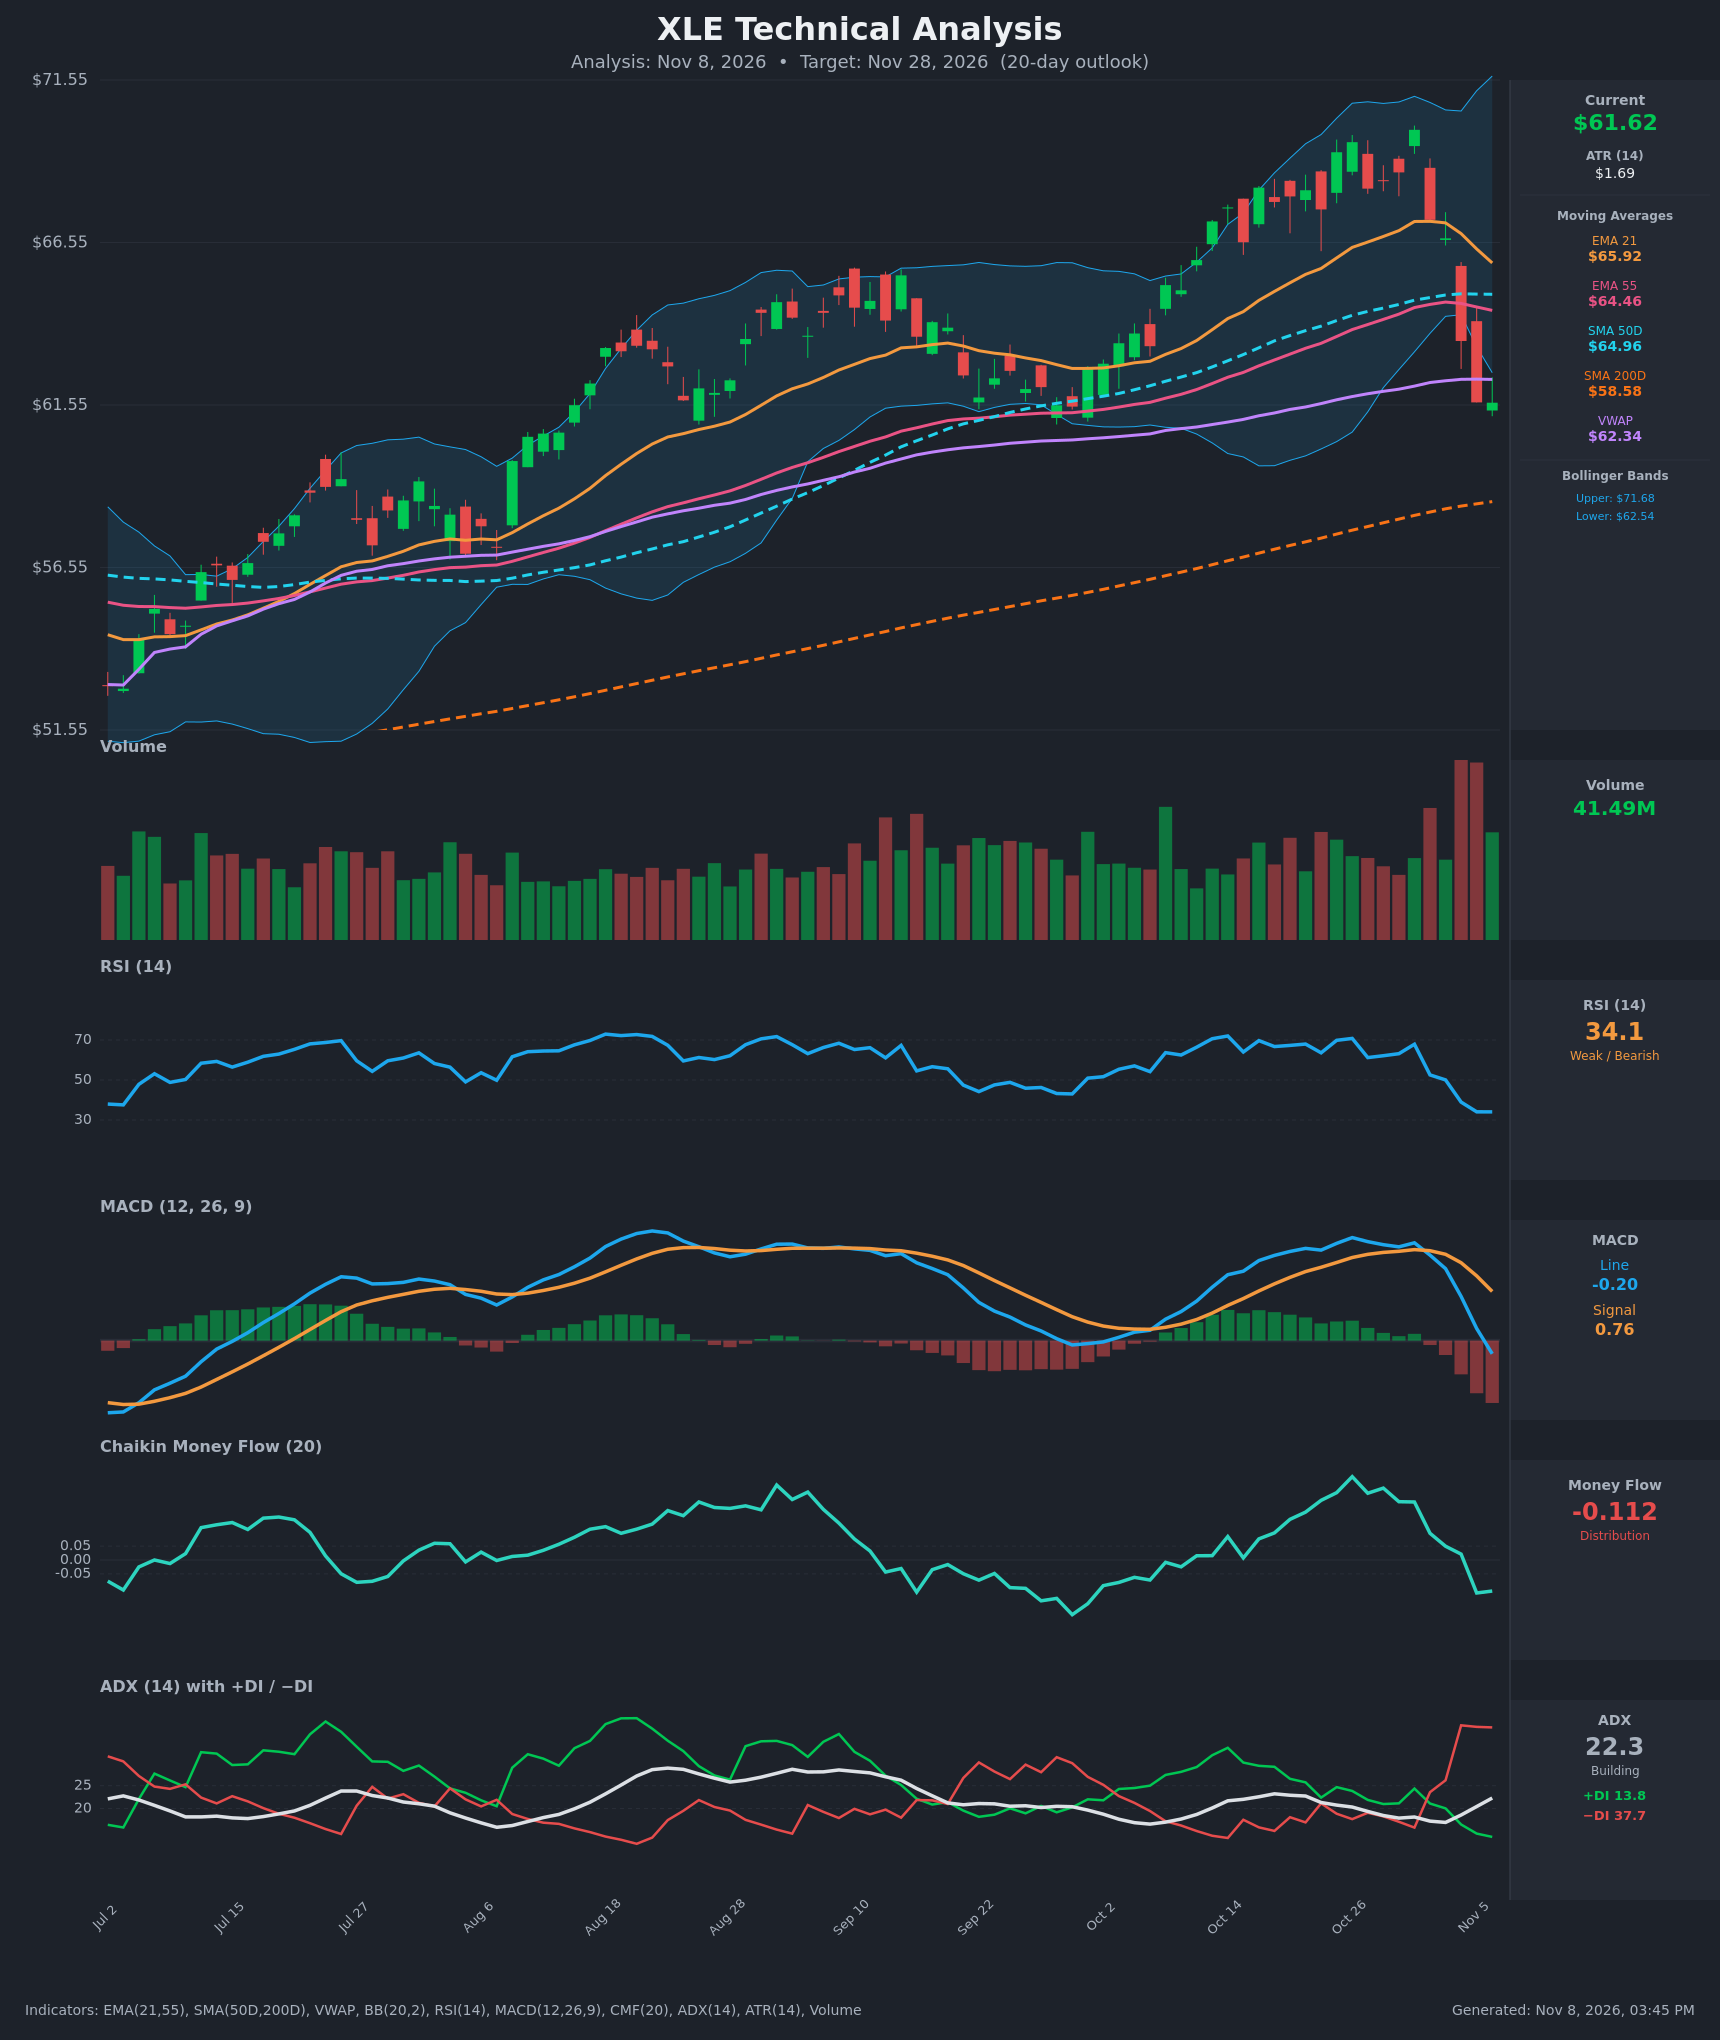
Analysis
TECHNICAL INDICATORS
- RSI (14): 34.06, down from about 70 in late October and flat over the last two bars. It is near the oversold zone but not yet below 30, so there is still room to fall. Momentum is clearly bearish. [Bearish]
- 20 EMA (EMA 21): $65.92, with price at $61.62 about 6.5% below it. The EMA is rolling over and acts as overhead resistance. Price is also below EMA 55 ($64.46), SMA 50 ($64.96) and VWAP ($62.34). [Bearish]
- MACD: Line -0.203 is below the signal at 0.758, and the histogram is deeply negative and expanding. The line crossed below the signal on Nov 2-3 and has now dropped below zero, a fresh bearish crossover with accelerating momentum. [Bearish]
- Bollinger Bands (20): Upper $71.68, lower $62.54. Price at $61.62 sits just below the lower band after a sharp expansion lower. This is a bearish momentum break, though it also raises the odds of a short-term snap-back toward the midline (about $67). [Bearish]
- CMF (20): -0.112, down from +0.30 in late October. It has crossed firmly below the -0.05 threshold, which signals distribution and heavy selling pressure. [Distribution]
- ADX (14): 22.3 and rising from 17, with -DI at 37.7 far above +DI at 13.8. The trend is not yet "strong" (>25), but it is strengthening quickly with bears in full control. [Strengthening Trend – Bearish]
- Volume: 41.49M on the latest bar. The breakdown candles on Nov 4-5 printed the highest volume of the whole chart, so the sell-off is backed by conviction and looks like institutional distribution. The latest bar is a small green candle on lower volume, which hints at stabilization. [Bearish – high-volume breakdown]
DIVERGENCES & TRENDS
- No bullish divergence yet. RSI (34) and price are making lows together, and RSI has not reached oversold territory.
- Trend shift: Price went from a strong uptrend (peak about $70.02 on Oct 30) to a violent two-day, high-volume breakdown of about 9%.
- Crossovers:
- The MACD bearish crossover and the drop below zero are confirmed.
- The -DI/+DI crossover occurred around Nov 2.
- Price broke below EMA 21, EMA 55, SMA 50, VWAP and the lower Bollinger Band.
- EMA 21 ($65.92) is converging toward EMA 55 ($64.46), so a bearish EMA cross is likely within days.
- The golden cross (SMA 50 above SMA 200) remains intact, and price is still above the rising SMA 200 ($58.58). The long-term trend is up but being tested.
- CMF: It has swung from strong accumulation to distribution within two weeks, confirming that smart money exited at the top.
- Stretch: Price is more than 1.5 ATR below VWAP and the lower band, so a relief bounce into $62.5–$64 is plausible before any further decline.
CHART PATTERNS
- Bearish Double Top (reversal): Highs near $69.64 (Oct 26) and $70.02 (Oct 30) were followed by a high-volume breakdown through the intermediate trough around $66.7–$67. The initial measured move (about $3.3 below the neckline) reaches roughly $63.4, and price has already overshot it. The move now points toward the next major support, the SMA 200 near $58.6.
- Possible Bear Flag / Bearish Pennant (continuation): If price bounces weakly toward $63–$64 on declining volume, that would form a bear flag. A break of the flag low would target the $58–$59 zone.
- The prior Sept–Oct base (about $60.8–$61.5) is the nearest horizontal support. A break below it would open the path to the SMA 200.
POTENTIAL SCENARIOS
- Scenario 1: Bearish Continuation to the SMA 200 — Distribution, a MACD below zero and −DI dominance drive further downside after a brief, weak bounce. Trigger: a daily close below $60.80 (the Sept swing low), or a rejection at VWAP near $62.34–$62.54. Target: $58.60–$60.00. Invalidation: a daily close above $64.50 (EMA 55). (50% probability)
- Scenario 2: Bullish Oversold Relief Bounce — Price is below the lower Bollinger Band with RSI near 34 and is still above the rising SMA 200, so a mean-reversion bounce is likely. Trigger: a reclaim of VWAP/lower band ($62.55) on rising volume. Target: $64.50–$65.90 (EMA 55 / EMA 21 resistance). Invalidation: a close below $60.00. (35% probability)
- Scenario 3: Neutral Base Between SMA 200 and VWAP — Price stabilizes and chops between $59.50 and $63. Trigger: ADX stalls near 22–25 and volume dries up. Target: $60.50–$62.50. Invalidation: a close outside $59.00–$63.50. (15% probability)
PRICE TARGETS
- Target Price: $60.20 (20-day horizon, ending about Nov 28)
- Expected Range: $57.30 to $63.60 (width $6.30, about 10.2% of the current price, consistent with the 14–21 day guidance)
- Key Levels: Support at $58.58 (SMA 200), Resistance at $62.34 (VWAP)
OVERALL BIAS
OVERALL BIAS: BEARISH - Price has broken down on heavy volume through every key moving average and the lower Bollinger Band. MACD has turned negative, CMF shows distribution, and −DI (37.7) dominates +DI (13.8) with ADX rising. A relief bounce is possible, but the path of least resistance is toward the SMA 200 near $58.6.
This is educational analysis and not financial advice.