BAC 27-day bullish forecast — Nov 8, 2026
- Bias: Bullish
- Timeframe: 27 days (made Nov 8, 2026, target date Dec 4, 2026)
- Price at analysis: $49.42
- Price target: $51.40
- Expected range: $46.50 – $54.00
- Result: Pending — graded after the close on Dec 4, 2026
Get a free AI analysis of BAC today
Analysis
TECHNICAL INDICATORS
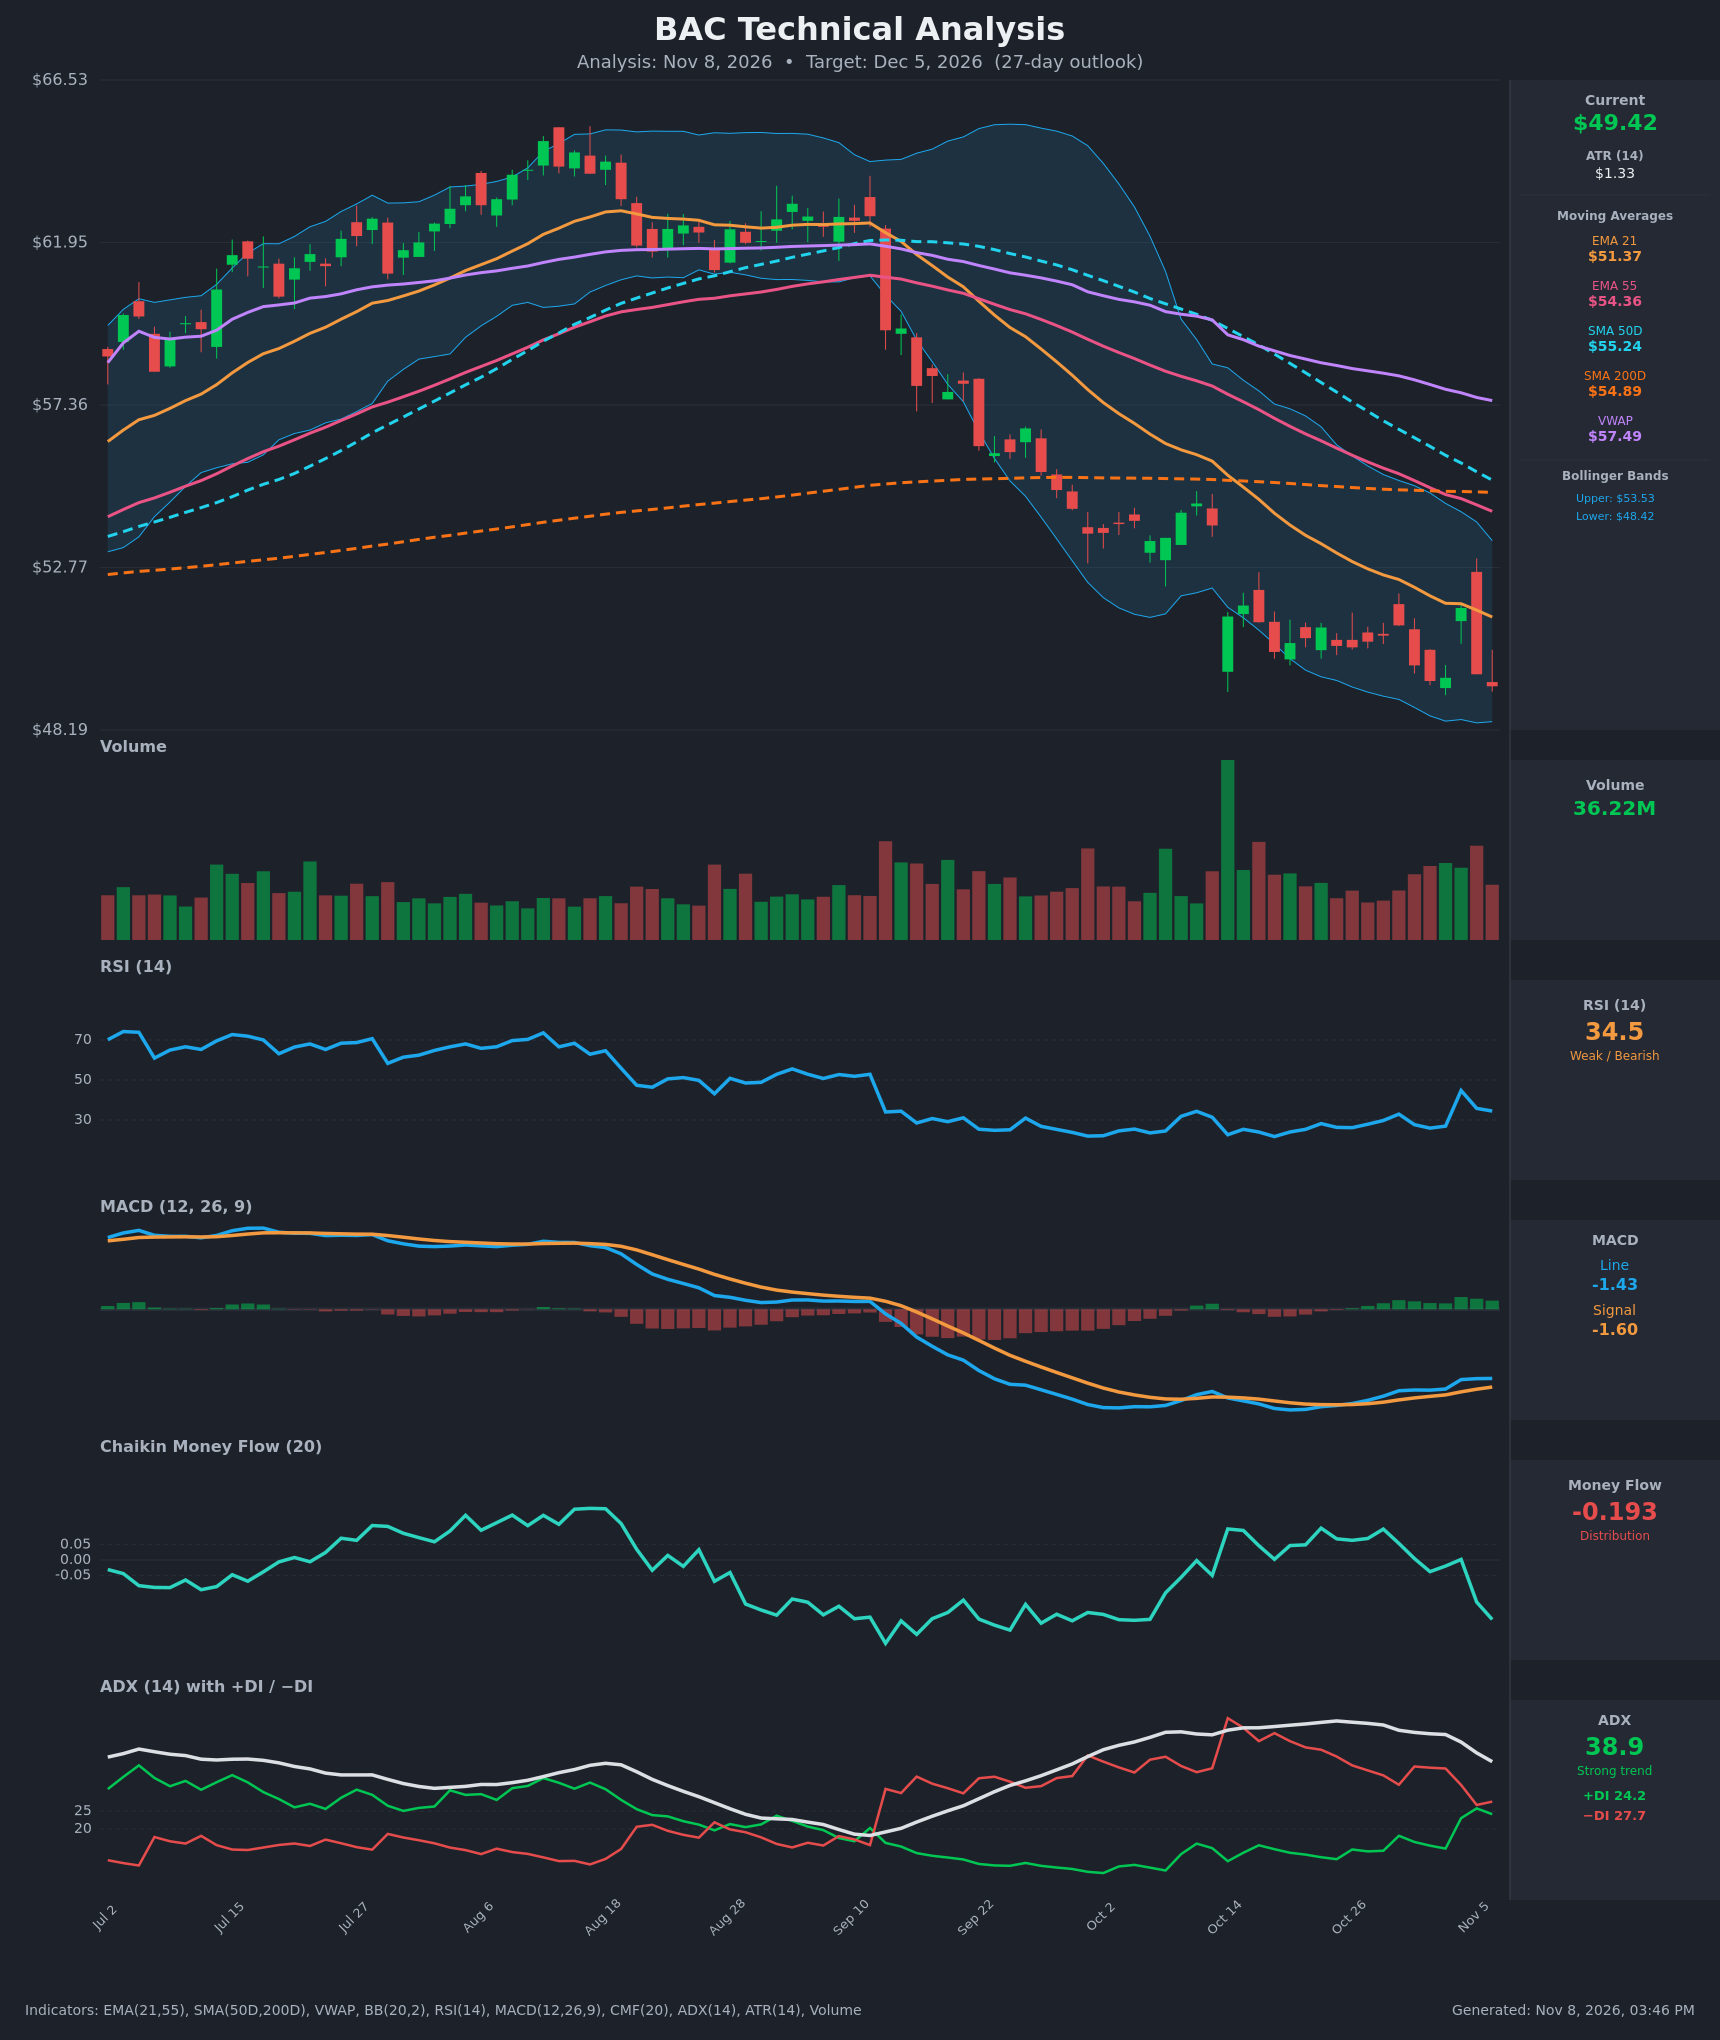
- RSI (14): 34.47, rebounding from a 21.7 low on Oct 19. RSI is making higher lows (21.7, 25.9, 26.9) while price sits at or below its prior lows. It is still below 50, and the Nov 4 spike to 44.7 failed. [Neutral]
- 20 EMA: EMA21 is $51.37 and still falling, with EMA55 at $54.36. Price is below both, so the EMA21 acts as overhead resistance. The Nov 4 close at $51.63 barely cleared it and was rejected the next day. [Bearish]
- MACD: The line is -1.425 and the signal is -1.603. The line crossed back above the signal around Oct 26 and the histogram is positive and rising. Both lines are still deeply negative, so this is only a basing or relief signal. [Bullish]
- Bollinger Bands (20): The bands run $48.42 to $53.53, and price at $49.42 sits in the lower quarter of the range. The bands are narrowing after the earlier expansion. Price has been riding the lower half, but it has not made a sustained break below the lower band. [Neutral]
- CMF (20): -0.193 and falling sharply from +0.10, which means clear distribution. Selling pressure is rising into the latest drop. This is the most bearish internal signal on the chart. [Distribution]
- ADX (14): 38.9 and falling from a 50.4 peak, so the downtrend is strong but losing steam. -DI at 27.7 is only slightly above +DI at 24.2. The gap was 30+ points two weeks ago, and +DI rose from 11.5 to 24.2. [Strong Trend, fading, Bearish bias]
- Volume: 36.22M, about average. There was a capitulation-style volume spike on Oct 14, and Nov 4 saw an up-day on elevated volume that was sold into immediately. Volume on recent down days is rising modestly. [Neutral to mildly bearish]
DIVERGENCES & TRENDS
- Bullish divergence: Price made a marginal lower low ($49.42 vs $50.39 on Oct 19) while RSI (34.5 vs 21.7) and the MACD line (-1.43 vs -2.07) both made clearly higher lows. Downside momentum is exhausting.
- Bearish confirmation lacking: CMF is diverging negatively. It has dropped from +0.10 to -0.19 while price tests support, so money flow does not confirm the bounce.
- Trend: Price is below the EMA21, EMA55, SMA50, SMA200 and VWAP ($57.49), a fully bearish structure. VWAP is far above price, and every rally has been sold.
- Crossovers: The EMA21 is already below the EMA55. The SMA50 ($55.24) is about to cross below the SMA200 ($54.89), a death cross with a gap of only about $0.35. A bullish MACD signal crossover has occurred. The DI lines are converging and could cross bullishly.
- Support tests: Support around $49.5 to $49.6 has been tested three times (Oct 14, Nov 2 and Nov 6).
CHART PATTERNS
- Primary pattern: A Bullish Triple Bottom or range base is forming at $49.5 to $51.6 after a roughly 25% decline from the $66 peak. The Bullish Falling Wedge is a secondary possibility, with lower highs and lows converging along the Bollinger lower band. If valid, the base breaks up through about $51.6 to $52.
- Measured move for a bullish resolution: The range height is about $2. A break above $51.63 targets about $53.5 to $54, which is the BB upper band and the SMA200/EMA55 zone.
- Risk to the pattern: The Nov 4 spike and rejection looks like a failed breakout. A close below $49.4 would turn the base into a Bearish Continuation (Flag or Descending Triangle) and project a measured move toward $47.5 or lower.
POTENTIAL SCENARIOS
- Scenario 1: Bullish Base Breakout and Mean Reversion — Price holds the $49.4 to $49.6 triple-tested floor. RSI and MACD divergence plays out, and ADX keeps fading as DI lines cross bullish. Price grinds back to the falling EMA21. Trigger: daily close above $51.63 (Nov 4 close and EMA21 area). Target: $51.40 to $53.50. Invalidation: daily close below $48.40. (45% probability)
- Scenario 2: Bearish Breakdown and Trend Continuation — The SMA50/SMA200 death cross completes and CMF distribution persists. Support gives way and the downtrend resumes. Trigger: close below $49.40 and then the $48.42 lower Bollinger Band on volume. Target: $46.50 to $47.50. Invalidation: reclaim of $51.63. (40% probability)
- Scenario 3: Neutral Chop in Range — Price oscillates between $49.4 and $51.6 for most of the period. ADX falls below 25 and the bands keep narrowing. Trigger: failure to close outside $49.4 to $51.6. Target: $50.00 to $50.80. Invalidation: close outside the range. (15% probability)
PRICE TARGETS
- Target Price: $51.40 (27-day, Dec 5, 2026)
- Expected Range: $46.50 to $54.00. This is a $7.50 width, or about 15.2% of the current price, consistent with the 12-18% guidance for 30-60 days scaled to 27 days.
- Key Levels: Support at $48.40 (lower Bollinger Band, just below the $49.4 triple-tested floor), Resistance at $51.63 (Nov 4 close, EMA21 area). Further resistance is at $53.50 (upper Bollinger Band).
OVERALL BIAS
OVERALL BIAS: BULLISH - Bullish RSI and MACD divergence, a triple-tested $49.5 floor, a fading ADX with converging DI lines, and price near the lower Bollinger Band favor a relief move toward the EMA21 near $51.4. The bias is modest in conviction, because CMF distribution, the imminent death cross and the failed Nov 4 rally mean a close below $49.40 would flip the bias bearish.
This is educational analysis and not financial advice.