BB 27-day bullish forecast — Nov 8, 2026
- Bias: Bullish
- Timeframe: 27 days (made Nov 8, 2026, target date Dec 4, 2026)
- Price at analysis: $8.74
- Price target: $9.00
- Expected range: $8.00 – $9.50
- Result: Pending — graded after the close on Dec 4, 2026
Get a free AI analysis of BB today
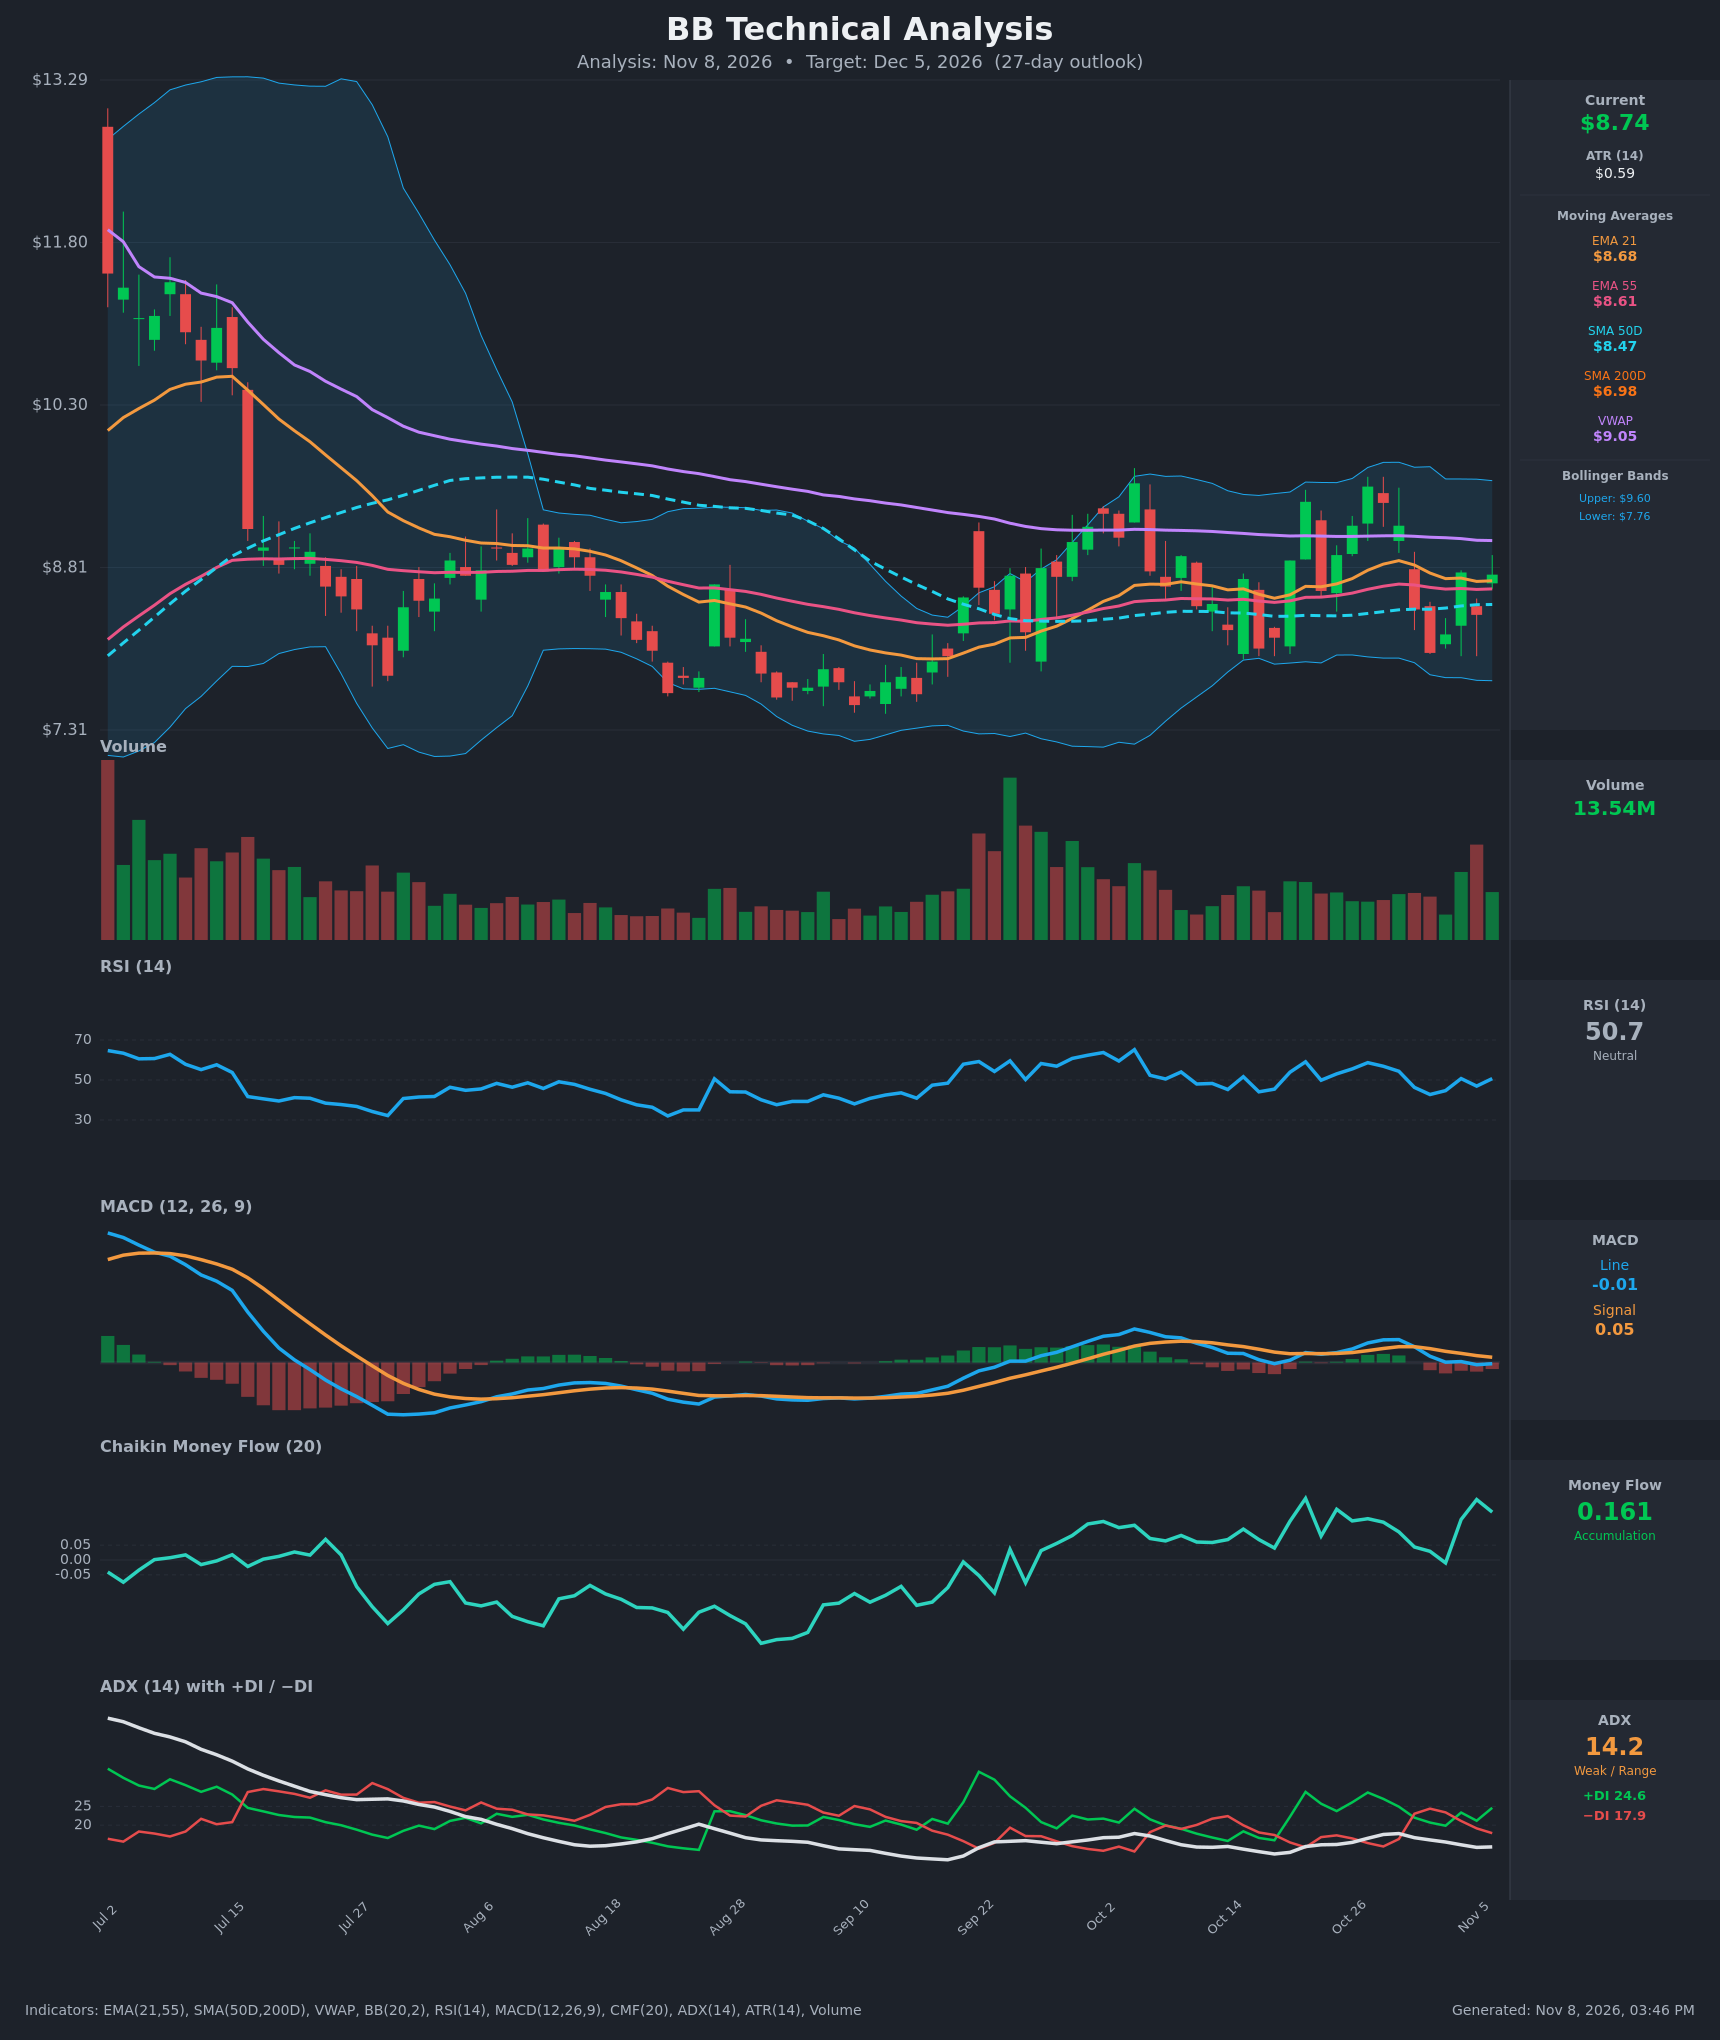
Analysis
TECHNICAL INDICATORS
- RSI (14): 50.69, dead neutral. It has oscillated between 43 and 59 for the last two weeks, after peaking near 59 on Oct 21 and 58.7 on Oct 27. There is no overbought or oversold pressure and no clear momentum direction. [Neutral]
- 20 EMA (EMA 21 = $8.68): Price at $8.74 is just above EMA21 ($8.68) and EMA55 ($8.61), so the short-term EMAs act as marginal support. EMA21 is above EMA55, a mild positive stack, but the gap is only about $0.07 and flattening. Price has crossed the EMAs repeatedly, which is typical of chop. [Neutral]
- MACD: Line -0.010, signal 0.046, histogram about -0.056. The line crossed below the signal on Oct 30–Nov 3 and has stayed below it since. It has fallen from a 0.199 peak and is hugging the zero line. Momentum has faded, but it is not deeply negative. [Bearish]
- Bollinger Bands (20): Upper $9.60, lower $7.76, midline about $8.68. Price sits almost exactly at the midline, so there is no band-walk and no squeeze release. The bands are moderately narrow compared with July–August. Price is neither stretched nor compressed. [Neutral]
- CMF (20): 0.161, well above +0.05. It has been positive on most recent bars and printed 0.203 on Nov 5. Buying pressure and accumulation are persistent even while price goes sideways. [Accumulation]
- ADX (14): 14.2, which is weak and range-bound. +DI (24.6) is above −DI (17.9), so bulls have a slight edge. The −DI spike above +DI around Oct 30–Nov 3 has reversed. [Weak Trend, bullish lean]
- Volume: 13.54M, an up-bar at about average to slightly above average levels. Volume spiked on the early-Nov rebound and is not drying up. There is no climactic selling and no breakout-level surge. [Neutral to mildly supportive]
Other context:
- Price is above SMA50 ($8.47) and well above SMA200 ($6.98). The golden-cross alignment (SMA50 > SMA200) is intact and the long-term structure is positive.
- Price is below VWAP ($9.05), which is overhead resistance of about 3.5%.
DIVERGENCES & TRENDS
- Bullish divergence (money flow): CMF has climbed from negative readings in Aug–Sep to +0.16 while price has only moved sideways. Accumulation is outpacing price.
- Higher lows on the larger structure: The swing lows rose from about $7.5–7.6 (Aug–Sep) to about $8.0 (Nov 2). This is a gradual uptrend within a base.
- Momentum fade (bearish): MACD rolled over from 0.199 to -0.010 after the Oct 27 high at $9.55. Price made a lower high versus the $9.55 peak on Oct 29, and RSI has not exceeded 59 in this leg.
- Crossovers:
- MACD bearish crossover (Oct 30), still unresolved.
- EMA21 > EMA55 and SMA50 > SMA200 both hold, with no death cross.
- DI: −DI briefly led, but +DI has retaken control.
- ADX trend: ADX at about 14 and flat or falling means there is no trend. The next move depends on a range break.
CHART PATTERNS
- Primary read: horizontal consolidation. This is a rectangle or range roughly between $8.00 and $9.55, with a mild ascending-triangle character (rising lows from Aug–Sep into $8.0, repeated rejections at $9.40–9.55). Per the diagram's Ascending Triangle, the bias is a breakout upward. A measured move from the range (about $1.5) from a break above $9.55 points to about $11.0, though that is outside the 27-day base case.
- Cautionary read: The $9.41 / $9.55 / $9.40 highs resemble a Bearish Double/Triple Top with a neckline near $8.0–8.2 (the Nov 2 low of $8.02). A close below $8.0 would target about $6.5–7.0, but that is not confirmed.
- Net: The pattern is unresolved. CMF accumulation, the golden-cross structure and the rising lows tilt it modestly toward an upside resolution, but the range is the dominant structure for now.
POTENTIAL SCENARIOS
- Scenario 1: Bullish Grind Toward VWAP/Range High — Accumulation (CMF 0.16) and the SMA50/EMA support lift price back toward VWAP and the upper range. Trigger: hold above $8.47–8.61 and a daily close above $9.05 (VWAP), with MACD recrossing above its signal. Target: $9.00–9.55, with extension toward $9.60 (upper band). Invalidation: daily close below $8.47 (SMA50). (45% probability)
- Scenario 2: Neutral Range Chop — ADX stays below 20 and price keeps oscillating around the EMAs and the $8.0–9.4 range. Trigger: repeated failures at $9.05 and bounces at about $8.4. Target: $8.40–$8.90. Invalidation: close above $9.60 or below $8.00. (33% probability)
- Scenario 3: Bearish Range Breakdown — MACD remains below signal and the lower-high structure (the $9.55 failure) leads to a retest of the lows. Trigger: close below $8.47 followed by a break of $8.02. Target: $7.76 (lower band) then about $7.50. Invalidation: reclaim of $8.70 with a MACD bullish cross. (22% probability)
PRICE TARGETS
- Target Price: $9.00 (27 days, Dec 5, 2026), about +3% from the current $8.74, near the VWAP/range-upper-mid zone.
- Expected Range: $8.00 to $9.50 (width $1.50 = about 17% of the current price, consistent with the 12–18% guidance for 30–60 days, scaled slightly down for 27 days; about 2.6x the ATR).
- Key Levels: Support at $8.47 (SMA50; secondary $8.02), Resistance at $9.05 (VWAP; then $9.55–9.60).
OVERALL BIAS
OVERALL BIAS: BULLISH - Persistent accumulation (CMF 0.16), +DI above −DI, price above all key moving averages (including a rising SMA200 and an intact golden cross) and rising swing lows favor a modest upside drift toward $9.00. The edge is small because ADX is 14, MACD is still below its signal, and VWAP/$9.55 cap rallies.
This is educational analysis and not financial advice.