IWM 27-day bearish forecast — Nov 8, 2026
- Bias: Bearish
- Timeframe: 27 days (made Nov 8, 2026, target date Dec 4, 2026)
- Price at analysis: $273.67
- Price target: $267.50
- Expected range: $251.00 – $286.00
- Result: Pending — graded after the close on Dec 4, 2026
Get a free AI analysis of IWM today
Analysis
TECHNICAL INDICATORS
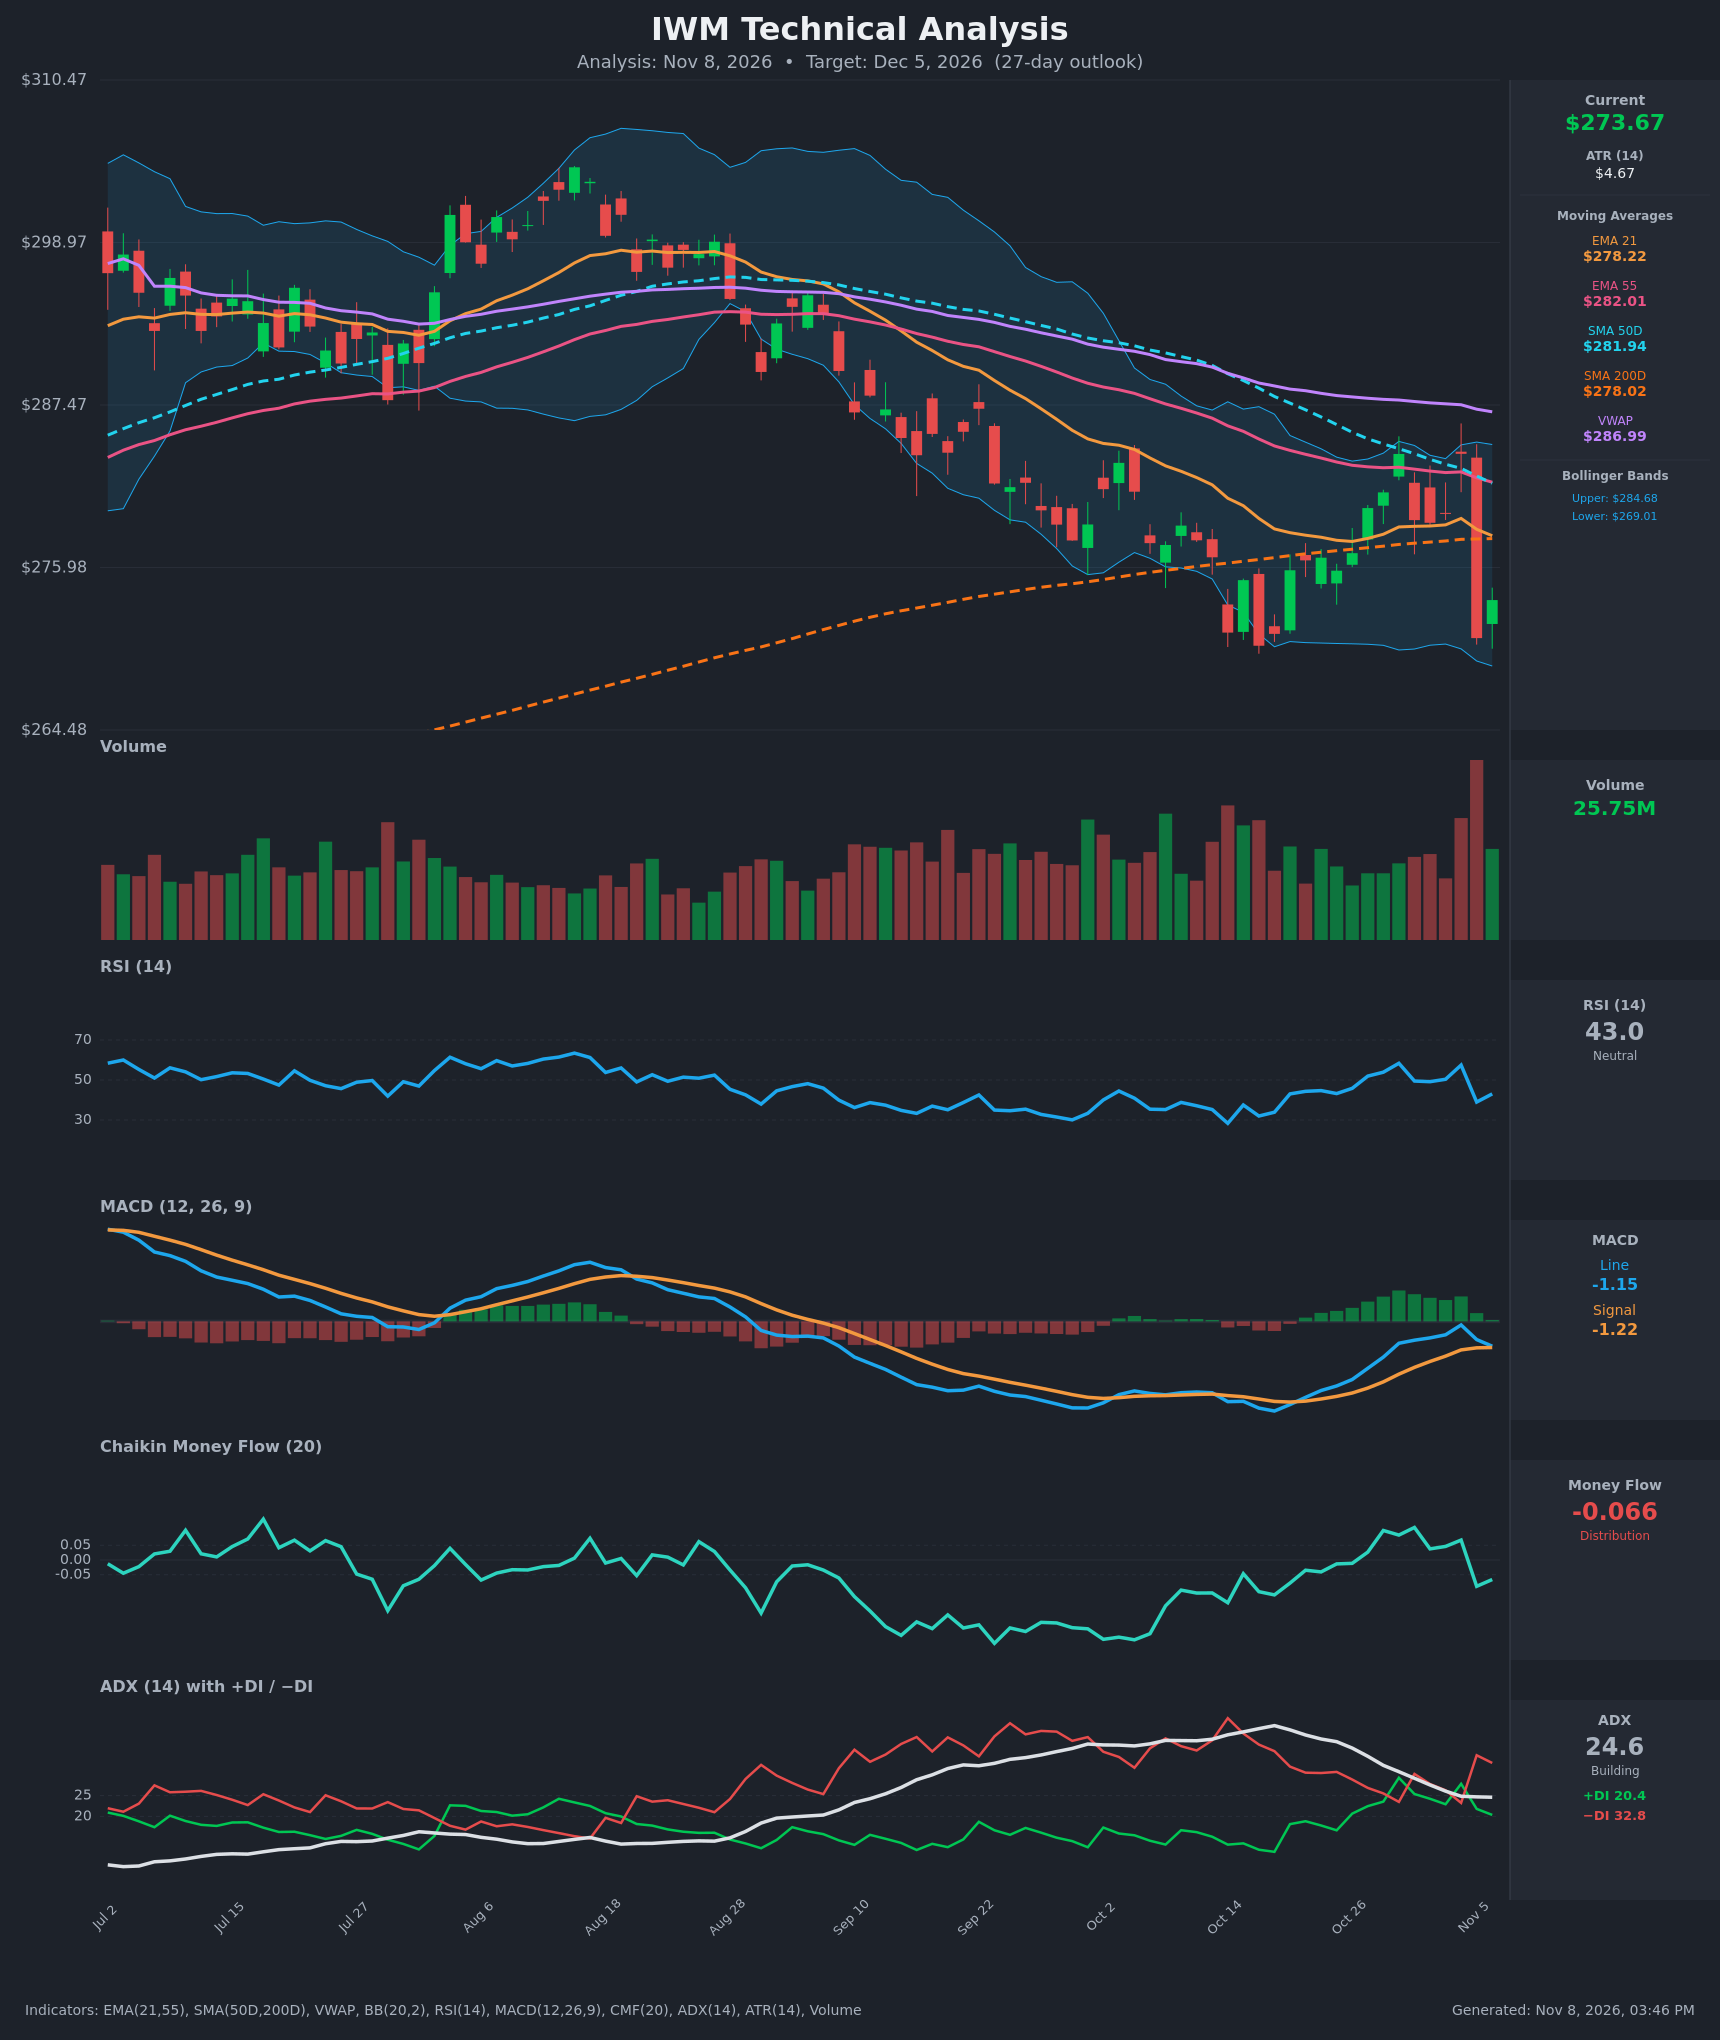
- RSI (14): 43.05, up from 39.0 on Nov 5 but down from 58.4 on Oct 29. It is below 50 and well short of oversold, so the lower highs in RSI (58 → 57 → 43) show momentum rolling over. [Bearish]
- 20 EMA: EMA21 is $278.22 and price is $273.67, about 1.6% below it. The EMA21 is now turning down after being briefly pierced on Nov 4, so it acts as dynamic resistance. EMA55 ($282.01) is also overhead. [Bearish]
- MACD: The line (-1.155) is only marginally above the signal (-1.216). The histogram is about +0.06 and has collapsed from its recent peak, and the line is rolling over after the Nov 5 drop. Both lines remain below zero, so the earlier bullish crossover has stalled and is close to failing. [Neutral]
- Bollinger Bands (20): The bands run $269.01 to $284.68, with the midline near $276.84. Price sits in the lower half after rejecting the upper band on Nov 4, then plunging to near the lower band on Nov 5. A failed upper-band test followed by a lower-band retest is a bearish range-rotation. [Bearish]
- CMF (20): -0.066, back below the -0.05 threshold after a brief positive stretch (+0.11 on Oct 30). The Nov 5 reversal produced distribution. [Distribution]
- ADX (14): 24.6, falling from 41.7, with −DI (32.8) well above +DI (20.4). The trend is moderate and fading in strength, but the bears are clearly in control. The Nov 5 −DI spike (23 → 34.6) reasserted bearish dominance. [Moderate Trend – Bearish]
- Volume: 25.75M on the bounce day, after a huge-volume red candle on Nov 5 (the largest volume bar on the chart). A heavy-volume reversal from the $284 resistance cluster signals institutional selling. The bounce volume is lower than the selloff volume. [Bearish]
DIVERGENCES & TRENDS
- Moving-average structure: Price is below EMA21, EMA55, SMA50D ($281.94), SMA200D ($278.02) and VWAP ($286.99). This is a clean bearish stack.
- SMA50D vs SMA200D: The gap is only about $3.9 and narrowing steadily, from $11.4 on Oct 19 to $3.9 now. A death cross is likely within the next few weeks if price stays here, so the 27-day window is exposed to it.
- EMA21 vs EMA55: EMA21 has been below EMA55 since late August, so there is no bullish crossover. The spread has stayed around $3.8 to $5.9.
- Price vs indicators: The Oct 19 low ($271.28) and Nov 5 low ($270.98) are roughly equal. RSI printed a higher low (33.9 → 39.0), which is a mild bullish divergence, but MACD is now fading and the bounce failed at the MA cluster.
- Failed breakout: Price rallied from $271 to $284 in 2 weeks, stalled exactly at the SMA50D/EMA55 zone, and reversed 4.6% in a single day. This is a classic lower-high rejection.
- DI/ADX: The +DI spike to 29.2 faded quickly, and −DI re-took control. ADX is no longer rising, so the downtrend is maturing and not accelerating.
CHART PATTERNS
- Bullish Double Bottom (possible): Two lows near $270 to $271 (Oct 19 and Nov 5) with a neckline near $284. It is not confirmed because price has not broken the neckline and the second low was reached via a sharp, high-volume selloff. A confirmed breakout above about $284 would target roughly $298. That is a low-probability outcome here.
- Descending channel / lower-highs structure (primary): Since August, price has made a series of lower highs ($299 → $286 → $284) and lower lows. This resembles a Descending Triangle with horizontal support near $270. A break below $269 to $270 would project a measured move toward the mid-$250s, toward the lower end of the range.
- Bollinger squeeze fade: The Nov 4 rejection at the upper band confirms $284 as major resistance.
POTENTIAL SCENARIOS
- Scenario 1: Bearish Support Retest and Breakdown — Price fails at the $278 EMA21/SMA200D cluster, revisits $270, and breaks the double-bottom support as −DI stays dominant and a death cross approaches. Trigger: daily close below $269 to $270 on elevated volume, or rejection at $278. Target: $267.50 in the base case, with extension to $258 to $260 on a clean break. Invalidation: daily close above $284.70 (upper Bollinger Band / SMA50D / EMA55 cluster). (50% probability)
- Scenario 2: Bullish Double-Bottom Recovery — Support at $270 holds again, RSI makes higher lows, and price reclaims the $278 cluster and rallies toward the neckline. Trigger: close above $278.20 with CMF turning positive. Target: $284 to $287. Invalidation: close below $269. (30% probability)
- Scenario 3: Neutral Range Chop — Price oscillates between $269 and $280 as ADX decays toward 20. Trigger: failure to break either $269 or $280 for 2 or more weeks. Target: $272 to $277. Invalidation: close outside the $268 to $281 range. (20% probability)
PRICE TARGETS
Range width check: $286.00 - $251.00 = $35.00, which is 12.8% of $273.67. That fits the 12-18% guidance for a 27-day horizon and is wider than any 14-day range.
- Target Price: $267.50 (27-day, Dec 5, 2026)
- Expected Range: $251.00 to $286.00
- Key Levels: Support at $269.00, Resistance at $278.20
OVERALL BIAS
OVERALL BIAS: BEARISH - Price is below every major moving average and VWAP, −DI (32.8) dominates +DI (20.4), CMF shows distribution, and the heavy-volume rejection at the $284 MA cluster confirms lower-high structure. The $270 double-bottom support is the key level, and a break would accelerate the decline. The modest conviction reflects RSI's higher low and the possible double bottom.
This is educational analysis and not financial advice.